

Line Movement Betting: How to Read and Act on Odds Shifts
Line movement betting is the practice of tracking how odds change between a sportsbook’s opening line and the closing line, then using that information to decide when, whether, and at what price to place a wager. The core skill is not spotting that a line moved. It is understanding why it moved and whether value still exists after the move.
When you see a line shift, run this three-step check before acting:
- Verify the source. Was the move triggered by news (injury, weather, lineup scratch) or by betting action (sharp money, public volume, liability management)?
- Compare to your number. Does the current line still offer positive expected value relative to your own projection?
- Decide: act, wait, or pass. If value remains, bet now. If the line is moving toward you, wait. If the move has already compressed the edge, pass.
One rule applies regardless of timing: once a sportsbook confirms your wager, your odds are locked at that price. Subsequent line moves do not change your payout.
Table of Contents
- What line movement means: opening, current, and closing lines
- Why lines move: the primary causes you need to separate
- When lines tend to move and why closing-line value is the benchmark
- How line movement behaves differently across bet types
- Reverse line movement: what it signals and how to use it
- How to read a line move and convert it into a decision
- Step-by-step examples of interpreting real line moves
- Who sets opening lines and how books adjust them
- Why lines differ by sportsbook and how to track and shop them
- How predictive analytics complements line movement analysis
- Key Takeaways
- The discipline line movement actually demands
- Mannysvariety gives you the model that makes market signals useful
- Authoritative sources and further reading
What line movement means: opening, current, and closing lines
Every betting market starts with an opening line, the number a sportsbook posts when it first accepts action on a game. From that point forward, the line can shift in response to bets, news, or market signals. The current line (also called the live line) is wherever the price sits at any given moment. The closing line is the final number posted just before the game begins.
Movement is measured in points for spreads and totals, and in cents for moneylines. If a spread opens at Kansas City -3 and closes at Kansas City -4.5, the line moved 1.5 points in Kansas City’s favor. Expressed in implied probability terms, a moneyline shift from -110 to -120 represents a move from roughly 52.4% to 54.5% implied probability.
Closing line value (CLV) is the standard metric for evaluating timing edge. If you bet a team at -3 and the line closes at -4.5, you captured 1.5 points of CLV. Closing lines are more accurate predictors of outcomes than opening lines, which makes beating the close a reliable long-term edge benchmark.
Why lines move: the primary causes you need to separate
Not every line move carries the same signal. The causes fall into five categories, and knowing which one drove a move determines how you should respond.
- New information. Injury reports, lineup scratches, weather forecasts, and travel disruptions produce the cleanest moves. The market is repricing a real change in game conditions.
- Sharp/professional money. When a known professional bettor or syndicate places a large wager, books respond quickly, often moving the line before the bet is even fully matched. Steam moves are the coordinated version: multiple books shift a full point or more within minutes, driven by professional groups hitting several books simultaneously.
- Public betting patterns. Heavy recreational volume on one side forces books to shade the line to attract action on the other side and balance their liability. This move reflects perception, not probability.
- Liability exposure. A book may move a line simply because too much money is concentrated on one outcome, regardless of whether that side is actually sharp.
- Market-following (copycat moves). Smaller or less liquid sportsbooks often copy moves from market-setting books rather than reacting to their own action.
The practical distinction: news-driven and sharp-driven moves tend to be sudden and directional. Public-driven and liability moves are gradual and often reverse or stall. Half-point moves are routine and frequently noise. Full-point moves off key NFL numbers like 3 and 7 carry more weight and usually reflect substantial money or significant new information.

When lines tend to move and why closing-line value is the benchmark
Timing shapes how you interpret a move. Sharp bettors typically act early in the week, when lines are soft and limits are lower. Books post opening numbers with limited information and deliberately set them to attract action and gather market intelligence. Professional money hits these soft openers, and the line adjusts quickly.
Public money arrives later, concentrated in the 24 hours before kickoff and especially in the final hours before game time. Late moves driven by recreational volume often push lines away from true probability, which is why the closing line tends to be the most accurate price in the market.
NFL moneyline odds typically shift about twice in the week before a contest. That figure puts the following industry-average move counts in context:
| Wager Type | Common Frequency of Line Moves (NFL) | Common Trigger |
|---|---|---|
| Moneyline | Frequent moves | Sharp action, injury news |
| Point spread | Less frequent moves | Key-number pressure, sharp money |
| Totals | Infrequent moves | Weather, late injury, sharp action |
Moneylines move most often because they are the most liquid market and the most sensitive to perceived probability shifts. Spreads and totals move less frequently, so their movements tend to carry stronger signals.
CLV is the practical output of all this timing. Bet early on a sharp-driven move and you may capture a better number than the close. Bet late into a public-driven move and you are likely paying a premium for a compressed line.
How line movement behaves differently across bet types
Movement does not look the same across every wager type, and the interpretation changes accordingly.
| Bet Type | Typical Move Size | Common Triggers | How to React |
|---|---|---|---|
| Moneyline | 5 cents | Sharp action, injury news, public volume | Track direction and timing; large moves signal real information |
| Point spread | 0.5–2 points | Key-number pressure, sharp money, liability | Key-number crosses (3, 7 in NFL) carry the most weight |
| Totals | 0.5–1.5 points | Weather, late injury, sharp action | Weather-driven moves are often clean signals; verify before acting |
| Props | Highly variable | Injury news, lineup changes, low liquidity | High volatility; RLM is less reliable in props markets |
Spreads are particularly sensitive to key numbers. In the NFL, the numbers 3 and 7 represent the most common margins of victory, so a spread crossing from -2.5 to -3 or from -6.5 to -7 carries disproportionate significance. Moneylines and props often show the most isolated, single-direction moves because they are more directly tied to perceived win probability and player availability. Totals are the wager type most frequently moved by external conditions, especially wind and precipitation, rather than betting action.
Reverse line movement: what it signals and how to use it
Reverse line movement (RLM) occurs when a line moves in the opposite direction from the side receiving the majority of bets or tickets. If 70% of bets are on Team A but the line moves toward Team B, that is RLM. The implication is that the money, not the tickets, drove the move. Sportsbooks react more to the dollar amount on each side than to the raw count of bets, and they weight professional money more heavily than recreational volume.
RLM is most reliable in major markets like the NFL, NBA, and MLB. In props and live markets, the signal is weaker because liquidity is lower and books have less information to react to.
When you spot RLM, apply these rules before acting:
- Confirm across multiple books. A single book moving against public percentages could reflect that book’s own liability, not a market-wide signal. Require at least two or three books to show the same directional move.
- Weigh magnitude and timing. A full-point RLM early in the week is a stronger signal than a half-point move on game day.
- Compare to your model before following. RLM is information, not a directive. If your projection already favors the sharp side, the move confirms your read. If your model disagrees, do not follow the move blindly.
- Check for news. Sometimes what looks like RLM is actually a news-driven move that has not yet been widely reported. Verify before assuming sharp action.
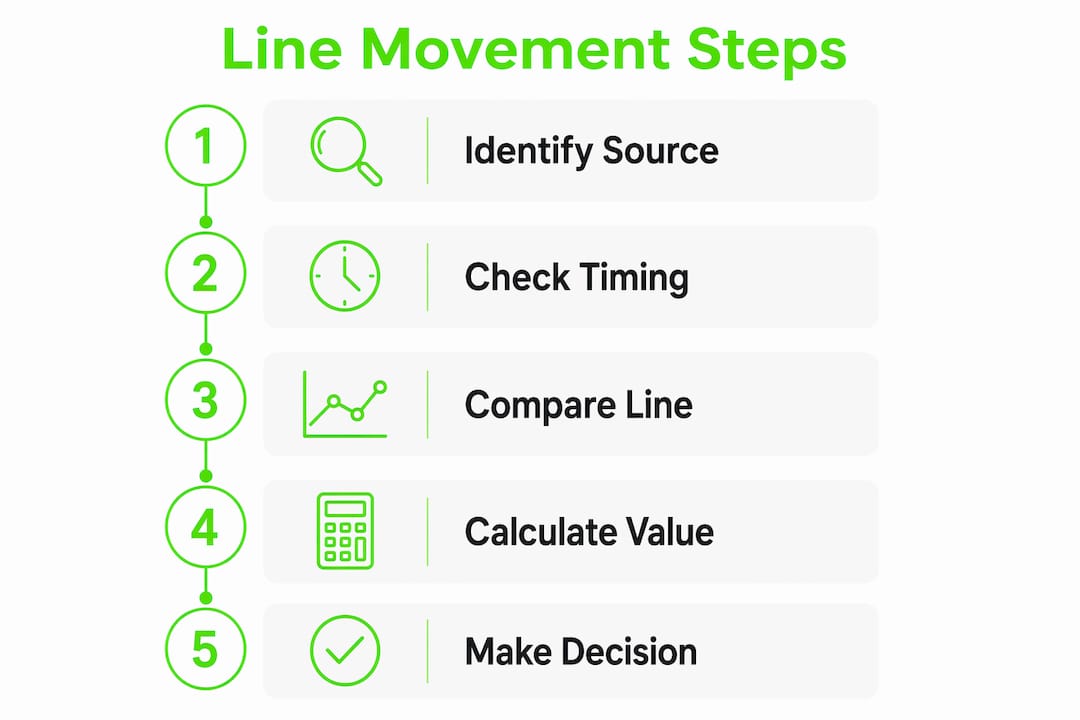
How to read a line move and convert it into a decision
The workflow below applies every time you see a meaningful line change. It keeps you from chasing moves that have already settled and from ignoring moves that still carry value.
Step 1: Identify the source. Check injury reports, weather, and lineup news first. If no news explains the move, it is likely action-driven.

Step 2: Check timing. An early-week move is more likely sharp. A same-day move is more likely public or liability-driven.
Step 3: Compare the current line to your number. This is the most important step. If you projected a team at -3 and the line has moved to -4.5, the value you identified may be gone. If the line moved from -5 to -3.5 and your number was -3, value has improved.
Step 4: Calculate expected value. A line that has moved in your favor still needs to clear the vig. Factor juice into your EV calculation before committing.
Step 5: Decide. Bet now if value remains and the line is moving against you. Wait if the line is moving toward you. Pass if the move has already compressed the edge below your threshold.
Pro Tip: Build your own number before checking the current line. Bettors who look at the market first anchor to the posted price and lose the objectivity needed to spot genuine value.
Common errors to avoid:
- Chasing steam after it settles. Steam moves can close in seconds. By the time a public alert fires, limits have tightened and the price has normalized.
- Overreacting to half-point moves. Routine noise. Focus on full-point moves, especially off key numbers.
- Using a single sportsbook as your reference. One book’s line reflects that book’s action, not the market. Always check multiple books.
- Ignoring vig and limits. A favorable line shift means nothing if the juice makes the bet EV-negative or if the book limits you before you can get your full size down.
Step-by-step examples of interpreting real line moves
These examples walk through the decision process at each stage of a line’s movement.
Example 1: Early-week sharp move
- Monday morning: the NFL spread opens at Patriots +6.5.
- By Tuesday afternoon, the line has moved to Patriots +5 across three major books with no injury news.
- Public betting percentages show 65% of tickets on the favorite, yet the line moved toward the underdog.
- This is RLM. Sharp money is on the Patriots.
- Your model projects the Patriots at +5.5. The current line of +5 is slightly worse than your number, so you wait.
- By Wednesday, the line settles at Patriots +5. You pass. The value you identified at +5.5 is no longer available.
Example 2: Late public push
- Saturday morning: a college football total opens at 52.5.
- By game day, 78% of bets are on the over and the total has climbed to 55.
- No weather event, no injury news. The move is pure public volume.
- Your model projects the total at 51. The market has moved 2.5 points away from your number.
- The under at 55 now offers significant CLV relative to your projection. You bet the under.
- Closing line: 55.5. You captured 0.5 points of CLV against the close.
Implied probability check for Example 2: A total of 55 at -110 implies 52.4% probability. Your model’s projection of 51 implies the over hits less than half the time at that number. The edge is clear once you convert both to probability terms rather than raw point values.
Who sets opening lines and how books adjust them
Opening lines are built by sportsbooks’ in-house trading teams using statistical models that incorporate historical data, team performance metrics, and market signals from other books. The largest market-setting books post first; smaller books often wait and copy those initial numbers.
From the moment a line goes live, books monitor the action and tag accounts by betting profile. A recreational bettor placing $50 on the favorite triggers a different response than a known sharp placing $5,000 on the underdog. Books respond more aggressively to professional money because sharps have a demonstrated edge. A single sharp bet can move a line more than hundreds of recreational tickets on the other side.
Books also move lines for reasons unrelated to probability. If a book has taken heavy action on one side and needs to attract the other side to balance its book, it will shade the line regardless of what the true probability suggests. This liability-driven movement is one reason why public-heavy lines often represent value on the other side, particularly late in the week when recreational volume peaks.
Why lines differ by sportsbook and how to track and shop them
Not all sportsbooks move at the same speed or in the same direction. Market-setting books with high limits and sharp clientele move first and move more. Recreational-focused books move later, often copying the market leaders, and may hold softer lines longer.
Bettors who need early access to soft lines should prioritize books known for higher limits and faster reactions. If you prefer to lock in odds without surprise changes, steadier books that move less aggressively suit that approach better.
Free public tools provide enough line-movement visibility for most recreational bettors. Paid services offer faster alerts and API access for bettors who need real-time data. Key features to look for in any tracking tool:
- Public consensus pages showing ticket and money percentages
- Line-movement charts with timestamps across multiple books
- Reverse-line-movement trackers that flag divergence between public action and line direction
- Odds comparison tables for live line shopping
Line-shopping checklist:
- Set price alerts on the lines you are tracking so you know when a threshold is crossed.
- Compare the current line across at least three books before placing any wager.
- Use multiple accounts for execution so you can take the best available number.
- Check limits before committing to a size. A favorable line at a book that caps you at $200 may not be worth the effort.
- Note which books move early and which move late. That pattern is repeatable and informs where you shop first.
Tracking odds across books also helps you spot entertainment-driven betting patterns that push casual bettors toward popular sides, inflating public percentages without reflecting real probability shifts.
How predictive analytics complements line movement analysis
Line movement tells you what the market thinks. A predictive model tells you what the numbers say. The most reliable workflow combines both.
At Mannysvariety, the process works in sequence: the platform’s sport-specific AI engines generate a projected number for each game using real-time analytics and thousands of simulations. That model number becomes the reference point. When the market line moves, the comparison is immediate. If the market moves toward the model’s projection, it confirms the read. If the market moves away, it either reveals an opportunity or signals that the model needs to account for new information.
Mannysvariety has tracked over 1,600 verified picks with a 63.5% win rate and a net return of 443.9 units — a publicly graded record that gives subscribers a documented baseline for evaluating model accuracy against market movement.
The workflow for subscribers:
- Review the model’s projected number and confidence level for the game.
- Monitor cross-book line movement from open through the day of the game.
- When the model and market align (line moves toward the model’s number), capture CLV by betting before the line fully adjusts.
- Record the bet price and the closing line for every wager to track CLV over time.
The Atlas analytics engine at Mannysvariety is built for exactly this integration, providing the model outputs that make market-signal interpretation repeatable rather than reactive.
Key Takeaways
Line movement is market information, not a betting instruction. The bettors who profit from it consistently are the ones who build a number first and use movement to confirm or reject their read.
| Point | Details |
|---|---|
| Verify before acting | Identify whether a move is news-driven, sharp-driven, or public-driven before making any decision. |
| CLV is the edge metric | Beating the closing line consistently is the most reliable long-term indicator of timing edge. |
| RLM requires confirmation | Reverse line movement is most reliable in NFL, NBA, and MLB; require multiple books to confirm before following. |
| Shop lines across books | A half-point difference in your favor can shift a losing bet to a winning one over a full season. |
| Mannysvariety pairs model with market | The platform’s verified 63.5% win rate and 443.9-unit net return give subscribers a documented model to compare against live line movement. |
The discipline line movement actually demands
Most bettors treat a moving line as a signal to act. The more useful frame is to treat it as a question: does this move confirm or contradict what I already believe about the game?
The bettors who consistently capture CLV are not the ones who react fastest. They are the ones who built a number before the market opened and used movement to validate their timing. When a line moves toward their number, they bet. When it moves away, they either wait or pass. There is no FOMO in that workflow because the decision was already made before the market moved.
Record-keeping is where this discipline becomes measurable. Tracking your bet price against the closing line on every wager tells you, over hundreds of bets, whether your timing is adding or subtracting value. A bettor who consistently beats the close by half a point is doing something right. One who consistently gets worse numbers than the close is chasing, not reading.
The honest reality about reverse line movement: it is a useful signal, not a system. Following RLM without a model to anchor the decision is just following sharp money blindly. Sharps are right more often than the public, but they are not infallible. The edge comes from combining market signals with your own projection, not from outsourcing your judgment to whoever moved the line.
Mannysvariety gives you the model that makes market signals useful
Reading line movement without a reference number is like reading a compass without knowing your destination. Mannysvariety provides that reference: sport-specific AI engines that generate projected numbers across NBA, MLB, NFL, NHL, and more, so every line move you track has something to compare against.

Subscribers get daily picks, player props, parlays, and a permanent archive of every graded pick. The platform’s 63.5% verified win rate and 443.9-unit net return are publicly documented, not marketing claims. For bettors who want to integrate model outputs with live market monitoring, the Core and Elite subscription tiers offer the tools to do exactly that. A free trial with limited features is available for bettors who want to test the workflow before committing. Check the current picks and pricing options to see which plan fits your approach.
Authoritative sources and further reading
These sources cover line movement theory, live tracking tools, and responsible gambling resources. Use them to validate moves, build a personal tracking dataset, and stay informed on market mechanics.
- RG.org — Changing Odds Guide: Covers how odds change, why placed bets lock at confirmation, and NFL moneyline move frequency data.
- BettingOnline.org — How to Read Line Movement: Detailed breakdown of steam, RLM, and which markets produce the most reliable signals.
- Market Math — Line Movement Guide: Explains CLV, book responsiveness, and how to choose sportsbooks based on your timing strategy.
- SportsbettingDime — Standard Line Movement: Industry-average move counts by wager type with NFL sample data.
- Betzonic — Line Movement Basics: Practical guide to steam moves, limits, and how quickly sharp windows close.
- OddsJam — Betting Line Movement: Overview of line-shopping tools, public consensus pages, and free vs. paid tracking options.
- NCPG — National Council on Problem Gambling: Responsible gambling resources and treatment referrals for U.S. bettors.
- Megasports Arena — My Picks Hub: Partner resource tracking how shifting lines before and during games affect engagement and betting behavior.
This article is general information about sports betting concepts, not professional financial or legal advice. Confirm current rules and regulations with your state’s gaming authority or a qualified professional before wagering.