

NFL Player Props Strategy: Win More Bets in 2026
The most effective NFL player prop betting strategy combines game script analysis, situational metrics, disciplined bankroll management, and line shopping across multiple sportsbooks. Bettors who shift focus from raw volume stats to snap counts, air yards, and red-zone targets consistently find more accurate edges than those relying on box-score numbers alone. The core tactics that separate profitable prop bettors from recreational noise:
- Prioritize game script first. Game totals above 48.5 favor pass-catcher overs; totals at 44 or below suppress offensive production and create mispriced unders.
- Use situational metrics, not volume stats. Snap counts, route participation, air yards, and red-zone target share reveal actual player involvement far better than weekly yardage averages.
- Flat bet 1–2% of your bankroll per prop, rising to 2–3% on high-conviction plays, to survive the variance inherent in prop markets.
- Shop lines across multiple sportsbooks. Prop line discrepancies of a few yards between books represent free equity that requires zero additional predictive skill.
- Bet unders on popular players. Recreational bettors systematically overbet star player overs, leaving undervalued unders as a consistent long-term edge.
- Monitor injury reports Thursday through Saturday. Sportsbooks often lag in adjusting prop lines after late-breaking news, creating exploitable windows before lines correct.
- Track closing line value (CLV). Consistently beating the closing line is the only reliable proof of genuine betting skill over time.
What does a solid NFL player props strategy actually look like?
The foundation of any winning approach to NFL props is understanding what drives player performance on a week-to-week basis, and it is rarely what casual bettors think. Raw stats like total yards or touchdowns from the previous game carry far less predictive weight than situational metrics that reflect actual role and usage.
Snap counts, route participation, air yards, and red-zone targets give a clearer picture of how a player is being used within an offense than any single-game yardage total. A receiver who ran 35 routes and drew 9 targets in a low-scoring game tells a very different story than one who posted 80 yards on 4 targets in a garbage-time blowout.
Game script is the single most important contextual variable. High-total games project more passing volume for both quarterbacks, which lifts the ceiling on receiver and tight end props. Low-total games push offenses toward a run-heavy approach, suppressing those same props. Bettors who ignore the game total and focus only on a player’s recent production are working with incomplete information.
Disciplined bet sizing and line shopping are not optional extras. They are the mechanical foundation that keeps a bettor in the game long enough for skill to show up in results. Without both, even accurate prop analysis produces inconsistent returns.
Key principles to apply every week:
- Identify the implied team total for each side before evaluating any prop.
- Replace recency-based analysis with season-long snap rate and target share trends.
- Set a fair-line estimate before checking the market, then bet only when the book’s number is meaningfully off your estimate.
- Avoid betting props on players whose roles are unclear due to injury or game-plan changes.
- Never chase losses within a single slate by increasing bet size.
How matchup data and player-specific metrics reveal prop value
Matchup analysis is where prop betting separates from guesswork. The most useful single metric for prop research is DVOA, or defense-adjusted value over average, published by Football Outsiders. DVOA breaks down defensive performance by position group, so a defense ranked 5th overall but 28th against tight ends carries a specific implication for the opposing tight end’s prop line that aggregate rankings completely miss.

Coverage scheme matters just as much as raw defensive rankings. Press-man defenses suppress short-route volume, which compresses reception totals and floors for slot receivers, while allowing more explosive plays that can push yardage over a line. Zone defenses do the opposite, generating more underneath completions and higher reception floors. Matching a zone-heavy defense against a high-volume slot receiver is a structurally different bet than the same line against a deep-threat outside receiver.
Target share and route participation are the player-specific metrics that anchor prop analysis. A receiver running 85% of offensive routes with a 28% target share on a pass-heavy team has a reliable floor that a 60% route runner with 15% target share does not. Air yards share further refines this by showing how much of the team’s downfield passing is directed at a specific player.
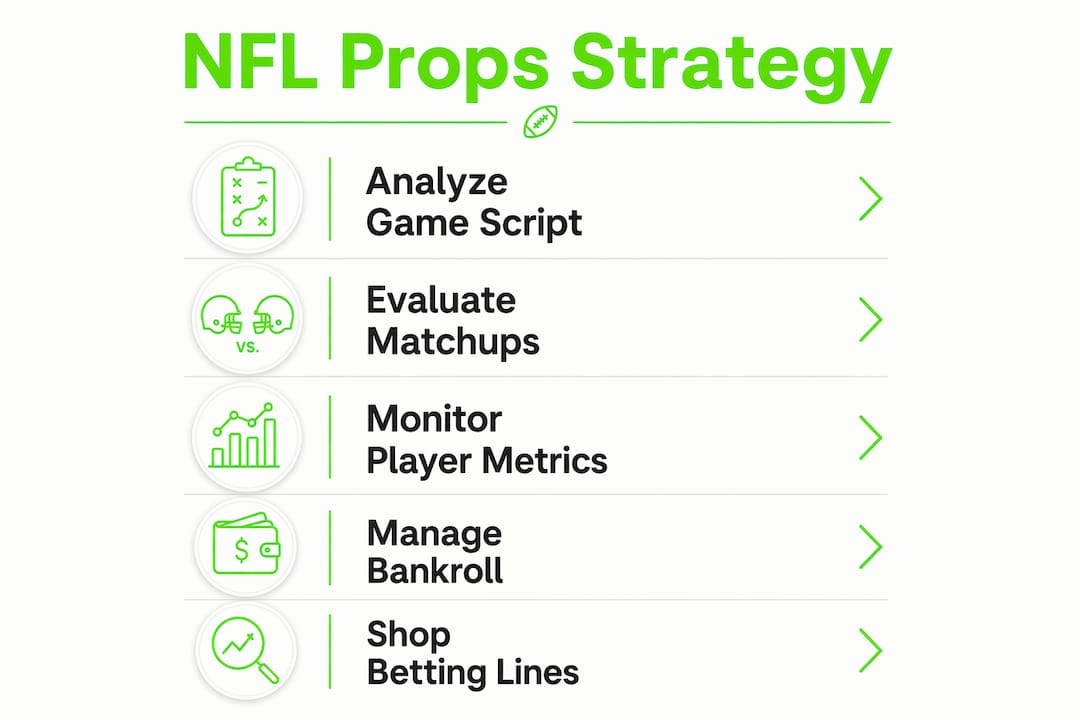
Correlation betting adds another layer. Stacking a quarterback’s passing yards over with the primary receiver’s receiving yards over, when both align with a high-total game script, increases expected value when the game plays out as projected. The props reinforce each other rather than creating independent variance.
Weather and venue function as modifiers on top of matchup data. Wind above 15 mph measurably reduces deep passing attempts and accuracy on throws beyond 20 yards, compressing receiver yardage props downward. Rain shifts game scripts toward the run, which benefits featured backs on favored teams. Dome teams visiting outdoor stadiums in cold or windy conditions often see their passing efficiency drop in ways that prop lines do not fully account for.
Pro Tip: Build a minimum data stack before evaluating any prop: implied team total, DVOA by position group from Football Outsiders, target share or air yards share for receivers, and the current injury report. Everything beyond that is incremental improvement on this base.
Bankroll management and line shopping for NFL props
Standard bankroll management for NFL prop bets calls for wagering a small, disciplined percentage of total bankroll per bet, adjusted upward for high-conviction plays. Props carry more variance than spread bets by design. Sportsbooks set strict individual limits on props, often $500–$2,000 per bet versus tens of thousands on spreads, precisely because the markets are more exploitable. That limit structure means per-bet edge matters more than volume.

Flat betting protects against the most common bankroll-destruction pattern: increasing stakes after a losing run to recover losses quickly. Prop markets have enough natural variance that a skilled bettor can lose several consecutive bets on well-researched plays. Discipline in sizing is what keeps the bankroll intact long enough for the edge to compound.
Line shopping is mathematically equivalent to improving your conversion rate without increasing risk or improving your predictions. Prop line discrepancies of 0.5–3 yards between sportsbooks are common, and on high-profile players in prime-time games, the best available number is often 4–8 yards better than the worst available number. Holding 3–4 active sportsbook accounts is the minimum for systematic prop bettors.
Timing is the other dimension of line shopping. Sportsbooks use automated models that lag behind late-breaking injury news and depth chart changes. When a key offensive lineman is ruled out Saturday morning or a starting receiver is downgraded to questionable, prop lines often take time to adjust manually. Bettors who check injury reports Thursday evening, Friday afternoon, and Saturday morning can find lines that have not yet moved to reflect updated information.
Pro Tip: Never bet a prop without first checking the line at a minimum of three sportsbooks. A 2-yard difference on a receiver’s yardage prop at standard -110 juice is a meaningful edge that costs nothing to capture.
Common types of NFL player props and how to approach each one
NFL prop markets cover a wide range of player performance categories, and each type rewards a slightly different research approach.
Passing yards and completions
The game total and implied team total are the primary inputs. A quarterback on a team implied at 27 points in a 50-point total game projects more passing volume than one implied at 22 points. Opponent pass defense DVOA, dome versus outdoor weather, and whether the team is a significant favorite or underdog all shift the baseline. Favorites tend to run more to protect leads, reducing passing volume late in games.
Rushing yards and attempts
This is the most straightforward prop category to research. Game script drives carry volume more than any individual player trait. A running back on a team favored by 7 or more points is likely to see a heavy workload in the second half as the offense grinds out the clock. Opponent defensive front rankings and offensive line injury reports are the key inputs. Explosive play potential matters less here than reliable carry volume.
Receiving yards and receptions
Coverage scheme, route participation, and weather are the three variables that matter most. Receptions props have tighter floors for high-volume slot receivers against zone defenses. Yardage props carry more variance and are more sensitive to wind and cold. A receiver reliant on deep routes in a game with 20 mph winds is a strong under candidate regardless of recent production.
Touchdown scorer props
These are high-variance bets by nature. Red-zone usage, specifically red-zone targets for receivers and red-zone carries for backs, is the most predictive metric. The volatility is real: even the league’s top red-zone receiver scores on fewer than half of his opportunities in any given week. Anytime touchdown scorer props carry better value than first-touchdown props because the sample of scoring opportunities is larger.
Long reception and longest rush props
These niche markets carry the most variance of any prop category. They function closer to lottery tickets than skill-based bets. Explosive play rate and matchup against a defense that allows big plays are the primary inputs, but the sample size within a single game is so small that even accurate analysis produces highly uncertain outcomes. Treat these as small-stake, high-variance plays rather than core betting positions.
How injury reports and market biases create under value
Late injury news is the most acute source of mispriced props in the NFL market. Lines are set days in advance, and when a key player’s status changes Thursday through Saturday, the prop lines for teammates often take time to reflect the updated role distribution. A starting receiver downgraded to questionable on Friday afternoon may see his prop line sit unchanged for hours while his backup’s volume is set to increase significantly.
Recreational bettors systematically overbet overs on star players due to narrative and recency bias. A receiver who posted 120 yards last week attracts heavy over action the following week regardless of matchup, game script, or injury context. Sportsbooks shade lines toward the over on popular players to balance action, which means the under is often priced at better value than the raw probability warrants.
The practical implication: unders on popular players in unfavorable matchups or low-total games tend to produce better long-term returns than overs on the same players. A star receiver facing a top-5 pass defense in a game with a 41-point total is a structurally sound under candidate, even if the public is loading the over based on his recent highlight-reel performance.
Consider a scenario where a top wide receiver is listed at 75.5 receiving yards against a press-man defense in a game with a 43-point total. The public sees last week’s 110-yard performance and bets the over heavily. The disciplined bettor sees a low-total game script, a coverage scheme that suppresses route volume, and a line that has been shaded upward by public money. The under at -110 carries genuine value that the market has mispriced.
Timing the bet matters here too. Unders on popular players often get better as game time approaches, because public money continues to push the over. Waiting until Sunday morning to place the under can capture additional line movement in your favor.
Rules and basics of NFL player prop bets
NFL player props are over/under wagers on individual player statistics within a single game. Sportsbooks set a line for a specific stat category, and bettors wager on whether the player will exceed or fall short of that number. Most standard props cover passing yards, rushing yards, receiving yards, receptions, and touchdown scores.
Sportsbooks settle prop wagers based on official NFL statistics. This matters for edge cases: a player who leaves a game early due to injury and does not return is typically graded on the stats he accumulated before exiting. Some books have specific rules for players who are listed as active but do not play, usually grading the bet as “no action” and refunding the wager. Checking the house rules before placing a bet on a questionable player is worth the 60 seconds it takes.
Bet limits on props are significantly lower than on spreads or totals. Standard bet limits at major sportsbooks are significantly lower on individual player props compared to spread bets, reflecting risk management due to exploitability. This is a deliberate risk management decision by sportsbooks, who recognize that prop markets are more exploitable than spread markets. The limit structure also means that building a large prop betting volume requires accounts at multiple books.
Prop availability windows vary by book and by game. Most props for a given week’s games open Tuesday or Wednesday and remain available until shortly before kickoff, sometimes as late as 5–10 minutes before the game starts. Same-game parlay props often have different availability windows than standalone props. Late-week injury news creates the most valuable betting windows, typically Thursday evening through Saturday morning, when lines have not yet adjusted to updated information.
Common pitfalls to avoid:
- Treating a two-game statistical trend as a stable baseline for a player’s production.
- Betting props on players with unclear injury designations without checking house rules on no-action grading.
- Ignoring the game total when evaluating any offensive prop.
- Placing same-game parlays as a primary edge product rather than using them selectively.
- Missing the Thursday-to-Saturday injury window, which is when prop lines are most mispriced relative to current information.
How advanced AI tools enhance NFL player prop betting
AI-powered analytics platforms process information at a speed and scale that manual research cannot match. When a depth chart change or injury update hits the wire, an AI system can recalculate prop probabilities across thousands of simulated game outcomes before a sportsbook’s manual adjustment team has even flagged the change. That speed advantage is most valuable in the Thursday-to-Saturday injury window, where the gap between new information and adjusted lines is widest.
Sport-specific predictive models run thousands of Monte Carlo simulations per game, generating probability distributions for individual player stat outcomes rather than single-point estimates. This produces a confidence range around each prop line, allowing bettors to quantify how much edge a given bet carries rather than making a binary yes/no judgment. Statistical confidence metrics and closing line value tracking then measure whether the bets placed consistently beat the closing number, which is the only reliable indicator of genuine skill over time.
Mannysvariety’s AI-powered platform has tracked a 63.5% win rate across over 1,600 picks, delivering a net return of 443.9 units, with a public grading record that bettors can verify directly.
Bankroll management and line shopping optimization are areas where AI tools add consistent, measurable value. A platform that monitors live line movements across multiple sportsbooks simultaneously can flag when a prop line at one book diverges from the consensus, identifying the best available number in real time. For bettors managing multiple active accounts, that automation replaces hours of manual comparison.
The Mannysvariety Atlas predictive engine applies these capabilities specifically to NFL player props, generating daily reports with prop recommendations backed by situational metrics, matchup data, and real-time injury updates. The platform’s transparent track record, with every pick permanently archived and publicly graded, gives bettors a verifiable basis for evaluating the system’s performance rather than relying on unverified claims.
Incorporating advanced statistical models into your prop research
Advanced statistical models change how bettors approach prop research by replacing intuition with probability. The core shift is from asking “will this player go over?” to “what is the probability distribution of this player’s output, and does the line reflect that distribution accurately?”
DVOA from Football Outsiders is the most widely used public model for this purpose. It adjusts defensive performance for opponent quality, giving a more accurate picture of how a defense actually performs against specific position groups than raw yards-allowed rankings. A defense that ranks 10th in yards allowed but 25th in pass defense DVOA against wide receivers has a specific implication for receiver props that the surface ranking obscures.
Expected points added (EPA) per play and success rate are two additional metrics that refine game script projections. A team with a high EPA per play on early downs tends to stay in passing situations longer, which sustains quarterback and receiver volume even in games where the score is close. Success rate measures how often a team achieves the yards needed to maintain a first down, which correlates with sustained drives and higher prop floors for featured players.
Target share stability is one of the most underused inputs in prop modeling. A receiver’s weekly target share fluctuates less than his weekly yardage total, making it a more reliable baseline for projecting prop floors. Bettors who anchor their receiver prop analysis to season-long target share rather than recent yardage totals build more accurate probability estimates and avoid the recency bias that inflates public action on overs.
Implied team totals, calculated from the spread and game total, are the bridge between game-level models and player-level props. A team implied at 28 points projects more offensive plays and more passing volume than one implied at 20 points. Mapping implied totals to historical snap counts and target distributions for each offensive role gives bettors a structured framework for setting fair lines before checking the market.
Case studies of successful NFL player prop betting strategies
The low-total under play
A tight end is listed at 52.5 receiving yards in a game with a 40-point total. The public sees his recent three-game average of 58 yards and bets the over. The disciplined bettor notes the low total, the opponent’s top-10 ranking in tight end coverage DVOA, and the fact that the home team is a 6-point favorite likely to run the ball in the second half. The under at -110 reflects a structural edge that the market has mispriced because public money is anchored to recent production rather than game context. Games with totals below 42 consistently produce more mispriced unders than overs, particularly for pass catchers.
The injury timing window
A starting wide receiver is listed as questionable Friday afternoon with a hamstring injury. His prop line sits at 68.5 receiving yards, set before the injury report dropped. The slot receiver behind him has a line of 38.5 yards. A bettor who checks the injury report Friday evening can bet the slot receiver’s over before the book adjusts the line upward to reflect the potential role expansion. By Saturday morning, the line has moved to 52.5. The bettor who acted Friday captured 14 yards of free equity, a direct result of monitoring the injury timing window that most recreational bettors miss entirely.
The correlated game script stack
A bettor projects a high-scoring game between two pass-heavy offenses with a 54-point total. Both quarterbacks are facing bottom-10 pass defenses in DVOA. The bettor stacks the home quarterback’s passing yards over with the primary receiver’s receiving yards over, building a correlated position that benefits from the same game outcome. If the game plays out as a shootout, both props cash together. The correlation between a quarterback’s passing volume and his primary receiver’s receiving volume is well-documented, and stacking these props in the right game script context produces higher expected value than betting each in isolation.
The star player under
A running back on a team favored by 10 points is listed at 78.5 rushing yards. His recent three-game average is 91 yards, and public money is heavy on the over. The bettor notes that a 10-point favorite is likely to be in a comfortable lead by the third quarter, at which point the backup back typically handles clock-killing carries. The featured back’s explosive play potential is high, but his carry volume in a blowout script is lower than the line assumes. The under reflects the game script reality that the public, focused on recent production, has ignored.
Key Takeaways
Winning NFL player prop bets consistently requires game script analysis, situational metrics, disciplined bankroll sizing, and systematic line shopping across multiple sportsbooks.
| Point | Details |
|---|---|
| Game script drives prop value | Totals above 48.5 favor pass-catcher overs; totals at 44 or below create mispriced unders. |
| Situational metrics over volume stats | Snap counts, air yards, route participation, and red-zone targets predict prop outcomes better than raw yardage averages. |
| Flat bet 1–2% of bankroll | Standard bankroll management calls for 1–2% per prop bet, rising to 2–3% on high-conviction plays. |
| Line shop for free equity | Prop line discrepancies of 0.5–3 yards between sportsbooks provide edge that requires no additional predictive skill. |
| Bet unders on popular players | Recreational overbetting of star player overs creates systematic value on unders in unfavorable matchups or low-total games. |
How Mannysvariety gives you a data-driven edge on NFL props

Mannysvariety applies sport-specific AI engines and thousands of game simulations to NFL player prop analysis, delivering daily picks with transparent, publicly graded track records. The platform has tracked a 63.5% win rate and a net return of 443.9 units across over 1,600 picks, with every result permanently archived so bettors can verify performance directly rather than taking claims at face value.
The platform covers the full range of NFL prop categories, from passing and rushing yards to receiving props and touchdown scorers, with real-time updates that account for late injury news and depth chart changes before lines adjust. Bettors who want a structured, data-driven approach to NFL props without building their own research stack from scratch can explore Mannysvariety’s picks and pricing to find the subscription tier that fits their betting volume.