

Sports Betting Algorithms: What Bettors Need to Know
Sports betting algorithms are mathematical systems that convert raw data into event probabilities, then compare those probabilities against bookmaker odds to identify bets where the price is wrong in your favor. The realistic outcome is not a guaranteed profit stream. It is a small, repeatable edge that compounds over hundreds of bets when the model is well-calibrated and staking is disciplined.
Pro Tip: Closing-line value (CLV) is a more reliable performance signal than raw win rate. If your bets consistently beat the closing odds, the model is finding real edges, regardless of short-term results.
Two numbers frame what responsible algorithmic betting actually looks like. Research shows that calibration-first model selection produced an ROI of +34.69% in controlled experiments, compared to -35.17% when models were selected by raw accuracy alone. That gap is the entire argument for prioritizing calibration overprediction count. Mannysvariety’s platform reports a high win rate across a large number of tracked picks, with a significant net return, all publicly archived and graded.
Table of Contents
- What types of algorithms do sports bettors actually use?
- How do sports betting algorithms actually work?
- How do algorithms detect value bets and real edges?
- What are the real risks and limits of betting algorithms?
- How do you build your own sports betting algorithm?
- What software features should you demand from any betting tool?
- How does Mannysvariety fit into an algorithmic betting workflow?
- How do you know if a model has a real, repeatable edge?
- What should you do this week, based on your goals?
- Key Takeaways
- The gap between what algorithms promise and what they actually deliver
- Mannysvariety: verified picks with a public track record
- Useful sources and data providers
What types of algorithms do sports bettors actually use?
The field covers several distinct model families, each suited to different markets and data conditions. Understanding which category a model belongs to tells you a lot about what it can and cannot do.
- Statistical distribution models (Poisson). Poisson regression estimates the probability of discrete outcomes like goals or runs scored. It works well for soccer totals and MLB run-line markets where scoring follows a roughly Poisson distribution.
- Elo and rating systems. Elo assigns a numeric strength rating to each team or player, updating after every result. It is most useful for moneyline markets in head-to-head sports like tennis and NBA, where relative strength is the dominant variable.
- Logistic and multinomial regression. These models output win/draw/loss probabilities from a feature set. They are transparent, fast to train, and well-suited to markets with clean historical data, such as NFL spreads.
- Gradient boosting (XGBoost, LightGBM). Tree-based ensemble methods handle non-linear feature interactions without manual engineering. They are the workhorse of most serious hobby projects and perform well on player prop markets where many correlated features exist.
- Neural networks and deep learning. Multi-layer networks can capture complex temporal patterns in sequence data. They require large datasets and careful regularization, making them more practical for high-volume sports like MLB or NBA than for lower-sample markets.
- Monte Carlo simulation. Rather than a single probability estimate, Monte Carlo runs thousands of simulated game outcomes to build a full probability distribution. It is particularly useful for in-play markets and parlay pricing, where path-dependency matters.
- Ensemble and hybrid models. Professional systems blend two or more model families, weighting outputs by calibration quality. A common pattern is a Poisson base model combined with a gradient-boosted adjustment layer for situational variables like travel fatigue or weather.
Algorithmic systems can scan thousands of markets quickly and identify patterns that humans miss, but their accuracy depends entirely on data quality and market access. No single model family dominates every sport or market type.
How do sports betting algorithms actually work?
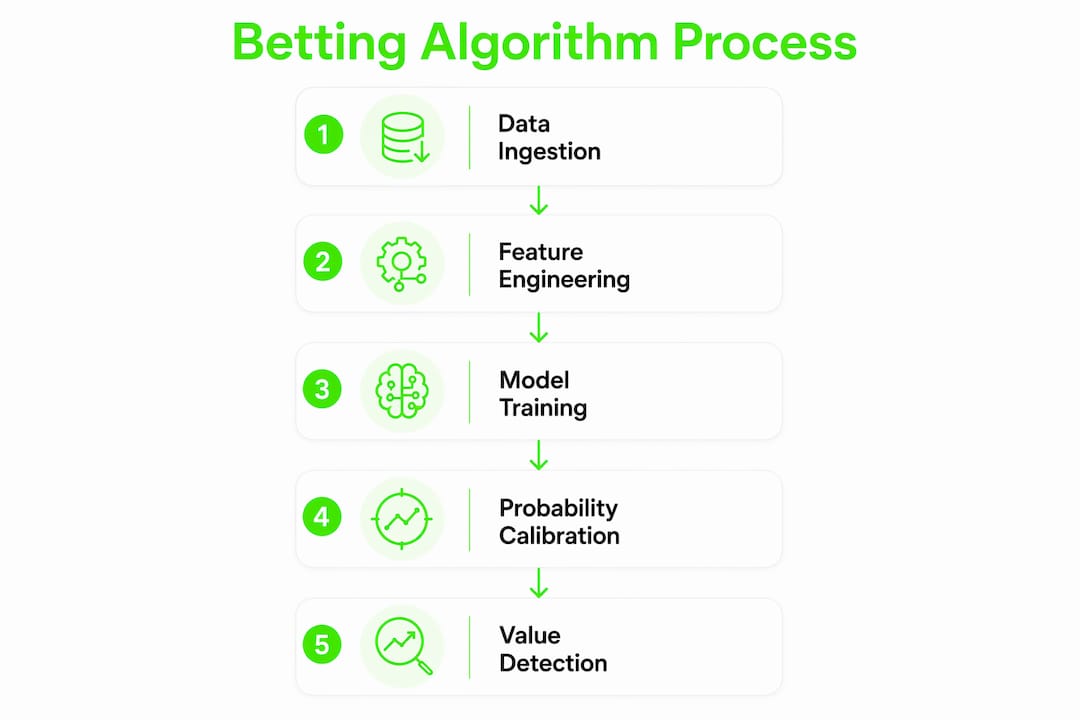
The end-to-end system has five stages: data ingestion, feature engineering, model training and inference, probability calibration, and market comparison. Each stage has failure points that can silently destroy a model’s edge.
Data ingestion and feature engineering
Raw feeds arrive from sports data APIs, odds aggregators, and injury/weather sources. An ETL (extract, transform, load) process cleans and structures this data into a feature store. Typical features include historical results, team and player statistics, rest days, travel distance, weather conditions, line movement, and public betting percentages. The quality of this feature store determines the ceiling of every model built on top of it.

Algorithmic sports betting systems ingest large datasets covering historical results, player stats, and real-time odds to compute event probabilities. The comparator then checks those probabilities against bookmaker lines to flag value.
Probability calibration and expected value
A model that predicts 60% win probability should win roughly 60 times out of 100. That alignment between predicted and actual frequencies is calibration. Without it, Kelly staking and EV calculations produce misleading outputs.
Expected value (EV) is the core decision metric:
EV = (Model Probability × Decimal Odds) − 1
If your model assigns a 55% win probability to a bet priced at +110 (decimal 2.10), EV = (0.55 × 2.10) − 1 = +0.155. That is a 15.5% positive edge on that bet. Positive EV bets are the only bets worth placing.
| Pipeline Stage | Primary Input | Output | Key Risk |
|---|---|---|---|
| Data ingestion | Raw API feeds, odds streams | Cleaned event records | Stale or missing data |
| Feature engineering | Cleaned records | Feature vectors | Lookahead bias, data leakage |
| Model training | Feature vectors | Probability estimates | Overfitting, poor calibration |
| Calibration | Raw probabilities | Calibrated probabilities | Miscalibration inflates EV |
| Market comparison | Calibrated probs vs. odds | Value bet signals | Odds latency, line movement |
Pro Tip: Odds latency kills in-play edges. For live markets, the window between a model signal and a bookmaker line adjustment can be under two seconds. Build execution speed into your architecture from day one, not as an afterthought.
How do algorithms detect value bets and real edges?
Value detection is the practical output of the entire pipeline. The goal is to find bets where the bookmaker’s implied probability is lower than the model’s calibrated probability.
De-vigging and implied probability
Bookmakers build a margin (the “vig” or “juice”) into every line. A standard -110/-110 spread line implies 52.4% probability on each side, which sums to 104.8%. The extra 4.8% is the vig. De-vigging removes that margin to reveal the true market-implied probability.
A simple de-vig formula for two-outcome markets:
True Probability = Implied Probability / (Sum of All Implied Probabilities)
Once you have the true market probability, compare it to your model’s output. A consistent gap in your favor is a value bet.
Closing-line value as the primary signal
CLV tracking is the strongest evidence that a model is beating the market. If you consistently bet at odds better than where the line closes, you are getting the better of the market price before sharp money moves it. Raw win rate fluctuates heavily over small samples. CLV is more stable and more predictive of long-term profitability.
- Value bets: Model probability exceeds de-vigged market probability by a meaningful margin.
- Soft lines: Lines that have not yet been sharpened by sharp action, often found at smaller books or early in the week.
- Arbitrage: Opposite sides of a market priced such that both can be backed for a guaranteed profit. Rare, quickly closed, and often triggers account restrictions.
Bankroll management and Kelly staking
Kelly Criterion sizes each bet as a fraction of bankroll proportional to the edge. The formula is: f = (bp − q) / b, where b is the decimal odds minus 1, p is model probability, and q is 1 − p. Full Kelly is aggressive. Most practitioners use quarter-Kelly or half-Kelly to reduce variance. Kelly requires well-calibrated probabilities to function correctly. A miscalibrated model fed into full Kelly can deplete a bankroll rapidly.

What are the real risks and limits of betting algorithms?
Traditional progression systems like Martingale and Fibonacci do not create a durable edge and are prone to large drawdowns. Algorithmic approaches are more disciplined, but they carry their own failure modes.
Technical failure modes
- Overfitting: A model that fits historical noise rather than signal will fail on new data. Regularization, cross-validation, and out-of-sample testing are the defenses.
- Data leakage: Using future information (injury reports, final scores) as features during training creates a model that cannot replicate its backtest performance in production.
- Poor calibration: A model with 70% raw accuracy but poor calibration will produce EV calculations that overstate the true edge.
- Sample-size variance: Fifty bets is not enough to distinguish skill from luck. Meaningful conclusions require hundreds of bets across varied conditions.
- Stale features: Player availability, coaching changes, and travel schedules change constantly. A feature store that is not updated daily will produce outdated signals.
- Survivorship bias: Backtests that only include teams or players still active today overstate historical performance.
Operational and market risks
- Account limits and restrictions from bookmakers who identify algorithmic or sharp betting patterns.
- Liquidity constraints that prevent full Kelly stakes from being placed at the modeled odds.
- Execution slippage when odds move between signal generation and bet placement.
- API reliability issues that cause missed bets or stale data during high-volume periods.
Legal and regulatory considerations for U.S. bettors
Sports betting is legal in a growing number of U.S. states following the 2018 Supreme Court ruling in Murphy v. NCAA, but legality varies by state. Always verify that online sports betting is permitted in your state before placing any wager. Gambling winnings are taxable income under federal law; the IRS requires reporting of all gambling winnings, and net losses may be deductible for itemizers. This article is general information, not legal or tax advice. Confirm current rules with a qualified professional or your state’s gaming commission.
Ethical and responsible gambling practices
Set a fixed bankroll before you start, and never bet more than 1%–5% of it on any single event. Avoid chasing losses by increasing stakes after a losing run. If you are automating bet placement, disclose that to any stakeholders or platforms where disclosure is required. Use the responsible gambling tools offered by licensed sportsbooks, including deposit limits and self-exclusion options.
How do you build your own sports betting algorithm?
A working model requires clean data, a disciplined testing process, and honest evaluation. Here is a practical roadmap.
Engineering steps
- Gather clean historical data. Source at least three to five seasons of game-level results, team and player statistics, and historical odds from a reputable sports data API. Verify completeness and check for gaps.
- Design your feature set. Build features that are available before game time: rest days, home/away splits, recent form, head-to-head records, weather, and line movement. Never include post-game data in training features.
- Split your data correctly. Reserve the most recent season as a held-out test set. Use earlier seasons for training and validation. Never shuffle time-series data randomly.
- Choose and train your model. Start with logistic regression as a baseline. Add gradient boosting (LightGBM or XGBoost) as a second model. Compare calibration curves, not just accuracy scores.
- Calibrate model outputs. Apply Platt scaling or isotonic regression to convert raw model scores into well-calibrated probabilities. Check the calibration curve before proceeding.
- Set execution rules. Define a minimum EV threshold (e.g., +3%) and a maximum stake size. Document these rules before you see live results, not after.
- Monitor and retrain. Walk-forward testing, frequent retraining, and automated end-of-season evaluation are standard practices in well-engineered models. Set a weekly retrain cadence during the season.
Backtesting and walk-forward validation
A simple backtest replays historical bets using model signals and records the outcome. The critical rule is that the model must only use data available at the time of each simulated bet. Walk-forward validation goes further: train on data through month N, test on month N+1, then roll the window forward. This prevents lookahead bias and gives a realistic estimate of live performance.
Python stack for hobbyists
The standard open-source stack covers most needs:
- pandas and NumPy for data manipulation and feature construction.
- scikit-learn for logistic regression, calibration tools (CalibratedClassifierCV), and cross-validation.
- LightGBM or XGBoost for gradient-boosted tree models.
- matplotlib or seaborn for calibration curve visualization.
The pipeline has four logical components: a data ingestion script that pulls from your API and writes to a local database, a feature builder that transforms raw records into model-ready vectors, a model training and calibration module, and an inference service that scores upcoming games and flags value bets against current odds.
What software features should you demand from any betting tool?
The tool ecosystem spans several categories. Knowing what each category does, and what to demand from it, prevents expensive mistakes.
Tool categories
- Sports data APIs: Provide historical results, live scores, player stats, and injury reports. Evaluate by data freshness, coverage depth, latency, and cost.
- Odds comparison feeds: Aggregate lines from multiple books in real time. Essential for de-vigging and CLV tracking.
- Feature-engineering libraries: Open-source (pandas, scikit-learn) or commercial platforms that automate feature construction and validation.
- Model training platforms: Cloud-based ML environments (Google Colab, AWS SageMaker) or local Python environments for training and calibrating models.
- Backtesting suites: Tools that replay historical signals against historical odds with configurable staking rules.
- Execution and automation APIs: Interfaces that connect model outputs to sportsbook accounts for automated or semi-automated bet placement where legally permitted.
- Pick-archive and grading tools: Systems that log every pick with timestamp, odds, and result, then calculate CLV, ROI, and unit returns over time.
Feature checklist for any tool or service
- Real-time odds feeds with sub-minute latency.
- Built-in de-vigging to expose true market-implied probabilities.
- Walk-forward backtesting with configurable training windows.
- Calibration metrics (Brier score, log-loss, calibration curve output).
- CLV reporting that compares bet price to closing line.
- Auditable pick archives with timestamped entries and public grading.
Red flags when vetting vendors
Opaque track records with no archived picks are the clearest warning sign. A vendor who reports only win rate without sample size, CLV data, or unit returns is not giving you enough information to evaluate the service. Missing walk-forward results suggest the backtest was run in-sample. No calibration metrics means the model’s probability outputs have not been validated against actual outcomes.
How does Mannysvariety fit into an algorithmic betting workflow?
Mannysvariety operates as a subscription AI picks service built on sport-specific predictive engines that run real-time analytics and thousands of Monte Carlo simulations per event. The platform covers NBA, MLB, NFL, NHL, PGA, MMA, soccer, and international tournaments.
The proof signals that matter most are all publicly available. Mannysvariety reports a high win rate across a large number of tracked picks, accompanied by a strong net return. Every pick is permanently archived with its original odds, timestamp, and graded result, accessible through the pick archive. That level of transparency is what the feature checklist above demands from any service.
When a subscription makes sense over DIY
- Daily bettors who want consistent, graded picks across multiple sports without maintaining their own data pipeline.
- Prop specialists who need player-level modeling that requires more granular data than most hobbyist setups can source.
- Bettors without time to build automation who still want access to calibrated, evidence-based signals rather than gut picks.
What to evaluate during a trial
- Check CLV on archived picks: are the recorded odds consistently better than the closing line?
- Review the grading methodology: does the platform grade picks at the odds listed, or at closing odds?
- Assess sample size: 1,600+ graded picks provides a statistically meaningful track record.
Pro Tip: During any trial period, track CLV on the picks you receive rather than just win/loss. Positive CLV over 30–50 picks is a stronger signal of model quality than a short winning streak.
The subscription tiers include Core and Elite plans, with day and week passes available for bettors who want to evaluate the service before committing to a monthly plan.
How do you know if a model has a real, repeatable edge?
A single winning month proves nothing. A repeatable edge shows up across multiple testing regimes and holds up when the model is evaluated on data it has never seen.
Testing checklist
- Out-of-sample backtest: Train on seasons 1–4, test on season 5. Never touch the test set until the model is finalized.
- Walk-forward validation: Roll the training window forward month by month and record performance on each held-out period.
- Rolling retrain: Retrain the model at a fixed cadence (weekly or monthly) to incorporate new data without reusing test-period information.
- Out-of-time evaluation: Test the model on a period from a different market regime (e.g., a COVID-shortened season) to check robustness.
Metrics that matter
A robust testing regimen includes calibration curves, Brier score, log-loss, and CLV tracking. These metrics together show whether probabilities are coherent and whether the model outpaces market prices.
| Metric | What it measures | Why it matters for betting |
|---|---|---|
| Brier score | Mean squared error of probability forecasts | Lower is better; measures overall calibration quality |
| Log-loss | Logarithmic penalty for confident wrong predictions | Penalizes overconfident miscalibrated models heavily |
| Calibration curve | Predicted vs. actual win rate by probability bucket | Shows whether 60% predictions win ~60% of the time |
| CLV | Bet price vs. closing line | Primary indicator of market-beating ability |
| ROI by confidence decile | Return on investment segmented by model confidence | Identifies which confidence tiers actually generate edge |
| Net units | Total profit in units staked | Practical bottom-line performance metric |
| Maximum drawdown | Largest peak-to-trough loss in the sample | Measures bankroll risk and strategy survivability |
Walk-forward example
Train a logistic regression on MLB moneyline data from 2019–2023. Test on 2024. Record Brier score, CLV, and net units. Then roll: train on 2020–2024, test on the first half of 2025. If CLV is consistently positive across both test windows and the Brier score is stable, the model has passed a meaningful robustness check. One positive test window is not enough.
What should you do this week, based on your goals?
The right next step depends on where you are starting from.
For the curious learner
- Read one academic paper on probability calibration in sports betting to understand the math behind EV.
- Pull three months of historical odds from a free API and calculate implied probabilities for 50 past games.
- Compare those implied probabilities to actual outcomes and plot a rough calibration curve.
- Identify one market (e.g., NFL moneylines) where you want to build a baseline model.
For the builder or hobbyist
- Set up a Python environment with pandas, scikit-learn, and LightGBM.
- Source at least two full seasons of clean game data for your target sport.
- Build a simple logistic regression baseline and run a walk-forward backtest on the most recent season.
- Calculate Brier score and plot a calibration curve before looking at profit metrics.
- Track CLV on your first 30 live signals before scaling stakes.
For the time-constrained bettor considering a subscription
- Identify a service with a publicly archived, graded pick history and at least several hundred picks in the sample.
- During the trial, record CLV on every pick you receive.
- After 30 picks, calculate your average CLV. Positive average CLV is the threshold for continuing.
- Set a bankroll limit before starting: no more than 1%–2% of your total bankroll per pick during evaluation.
Risk-control checklist
- Never exceed 5% of bankroll on a single bet, even with high-confidence signals.
- Review model performance monthly, not daily, to avoid overreacting to variance.
- If a model or service shows negative CLV over 50+ picks, stop and reassess before adding capital.
- Run a Monte Carlo simulation on your staking plan to estimate realistic drawdown ranges before going live.
Key Takeaways
Sports betting algorithms find edges by converting data into calibrated probabilities and comparing them to bookmaker odds, and CLV is the single most reliable metric for confirming that an edge is real.
| Point | Details |
|---|---|
| Calibration beats accuracy | A model selected for calibration quality outperforms one selected by raw accuracy in ROI experiments. |
| CLV is the primary signal | Consistently beating the closing line is stronger evidence of a real edge than short-term win rate. |
| Backtest rigor is non-negotiable | Walk-forward validation on held-out data is the minimum standard; in-sample backtests are unreliable. |
| Bankroll discipline protects capital | Use fractional Kelly (quarter or half) and cap individual bets at 1%–5% of total bankroll. |
| Mannysvariety offers verified transparency | Over 1,600 archived, graded picks with a reported 63.5% win rate and 443.9 net units returned are publicly accessible. |
The gap between what algorithms promise and what they actually deliver
The most common mistake bettors make with algorithmic systems is treating a backtest as a business plan. A backtest is a hypothesis. Walk-forward validation is the first real test. Live performance over hundreds of bets is the only confirmation that matters.
The calibration research makes this concrete. The difference between a model chosen for accuracy and one chosen for calibration is not a minor technical detail. In controlled experiments, that single decision separated a +34.69% ROI from a -35.17% ROI. Most bettors never look at a calibration curve. They look at win rate, which is the least informative metric for long-term profitability.
CLV deserves more attention than it gets. A bettor who consistently beats closing lines is demonstrating that their information or model is better than the market’s at the time of the bet. That is a verifiable, repeatable signal. A bettor who wins 60% of picks over 40 games might just be running hot.
The responsible use of these tools also means accepting that no algorithm eliminates variance. Even a well-calibrated model with genuine positive CLV will have losing months. The bankroll management rules exist precisely because the edge is small and the variance is real. Sizing bets correctly is not a secondary concern. It is what determines whether a real edge survives long enough to compound.
Mannysvariety: verified picks with a public track record
If building and maintaining your own data pipeline is not realistic, a subscription to a verified AI picks service is the practical alternative. Mannysvariety delivers daily picks, player props, parlays, and market analysis across NBA, MLB, NFL, NHL, PGA, MMA, and soccer, all generated by sport-specific AI engines running thousands of simulations per event.

The proof is public. Every pick is permanently archived with its original odds and graded result, available through the pick archive and analytics dashboard. The reported track record covers more than 1,600 picks at a 63.5% win rate and 443.9 net units returned. That is the kind of auditable history the testing checklist in this article demands from any service.
Entry options include Core and Elite subscription tiers, plus day and week passes for bettors who want to run a proper 30-pick CLV evaluation before committing. Check current plan details and pricing at Mannysvariety’s pricing page and start your trial with the CLV tracking framework from this article already in hand.
Useful sources and data providers
Building or evaluating a sports betting algorithm requires reliable data, credible tooling, and access to the academic literature that underpins the methodology.
- Sports data APIs. Evaluate any provider on four criteria: data freshness (sub-hour update cadence for live markets), historical coverage depth (at least five seasons), endpoint reliability, and cost per call. Free tiers are useful for prototyping but rarely sufficient for production.
- Odds aggregation feeds. Real-time odds from multiple books are required for de-vigging and CLV tracking. Look for feeds that include opening lines, line movement history, and closing odds.
- Machine learning and calibration research. The peer-reviewed literature on calibration-first model selection is the strongest academic foundation for the methodology described in this article.
- Open-source model examples. Public repositories that implement walk-forward backtesting, CLV tracking, and automated retraining provide concrete engineering patterns to study and adapt.
- Sports betting systems overview. A useful reference for understanding the history of betting systems and why progression-based approaches fail against data-driven ones.
- Bankroll and staking methodology. Covers Kelly Criterion, progressive staking, and the practical cautions around each approach.
- Mannysvariety pick archive. The archived picks and grading reports serve as a live example of the transparent track record this article recommends demanding from any picks service.
When evaluating a data provider, prioritize freshness and coverage over price. A cheaper feed with a 24-hour lag is not useful for live markets. Confirm that historical odds are included, not just results, since CLV tracking requires both sides of the equation.