

Act On 400ms Data: Real Time Betting Analytics for Bettors & Analysts
Real-time betting analytics turn live odds, play-by-play data, and player props into probability updates fast enough to act on before a sportsbook resets its lines. The practical next step is simple: either build a stack on normalized, sub-second feeds and track closing line value (CLV) yourself, or subscribe to a service that already runs AI engines and publishes the results.
TL;DR:
- Employ push-based streaming like WebSocket for real-time odds updates, ensuring latency stays below 400 milliseconds during chaotic game moments.
- Use model confidence deltas and bankroll bounds to automate bet sizing, focusing on event-driven mispricings like injuries or VAR reviews.
- Verify provider transparency by confirming archived picks, consistent grading, and disclosure of model versions to assess genuine track record.
- Maintain a diversified feed setup; relying on a single book or delayed data increases the risk of trading on stale information.
- Validate performance metrics such as closing line value and ROI over at least 100 bets to ensure your strategy has a real edge.
Table of Contents
- What Live Betting Data Feeds Actually Deliver
- How Do You Judge Feed Quality in Real Time?
- How Predictive Models Turn Live Data Into Probabilities
- The Performance Metrics That Prove You Have an Edge
- Checklist for Wiring Live Feeds Into Your Decision Engine
- Turning Analytics Into a Live Betting Strategy
- What Trust Signals Should You Demand From an AI Betting Provider?
- Build Your Own Stack, or Subscribe?
- Get Live, AI-Graded Picks Without Building the Stack Yourself
- Sources
What Live Betting Data Feeds Actually Deliver
A real-time feed carries more than a scoreboard, delivering detailed player-level data and scouting intelligence that can enhance live analytics and player props. It streams in-play moneylines, spreads, totals, player props, alternate lines, and play-by-play events, each stamped with the moment it changed. That timestamp matters more than the number itself, since a quote that’s four seconds old during a scoring run is already wrong.
Providers deliver this data two ways. Push-based methods like Server-Sent Events (SSE) or WebSocket connections stream updates the instant a book moves, while REST polling checks for changes on a fixed interval. Polling is easier to build but always lags behind push delivery, which is why serious in-play systems lean on SSE or WebSocket streams with sub-second to low-second cadences.
Working with a single sportsbook’s raw feed also creates hidden risk, since formats, IDs, and update timing differ book to book. A normalized API solves that by mapping hundreds of sources into one consistent schema.
When evaluating a provider, check:
- Whether odds, props, and alternates arrive on the same feed or separate ones
- The stated median refresh time and whether it’s independently verifiable
- How many sportsbooks and markets are actually mapped, not just advertised
- Whether play-by-play events carry the same timestamp precision as the odds
How Do You Judge Feed Quality in Real Time?
Latency and freshness are not the same thing, and confusing them costs bettors money. Latency measures how long data takes to travel from the book to your system. Freshness measures how current that data still is once it lands, which depends on how often the underlying market actually updates.
The diagnostics worth running against any trial feed:
- Pull the per-book latency endpoint, if the provider offers one, and log it during a live game rather than a quiet pregame window.
- Compare “first-seen” and “last-seen” timestamps on the same line across two different books to catch clock drift.
- Watch for stale quotes: a price that hasn’t moved in 90 seconds during an active possession is a red flag, not a stable line.
- Check whether market IDs stay consistent across a game, since desynced IDs silently break your history.
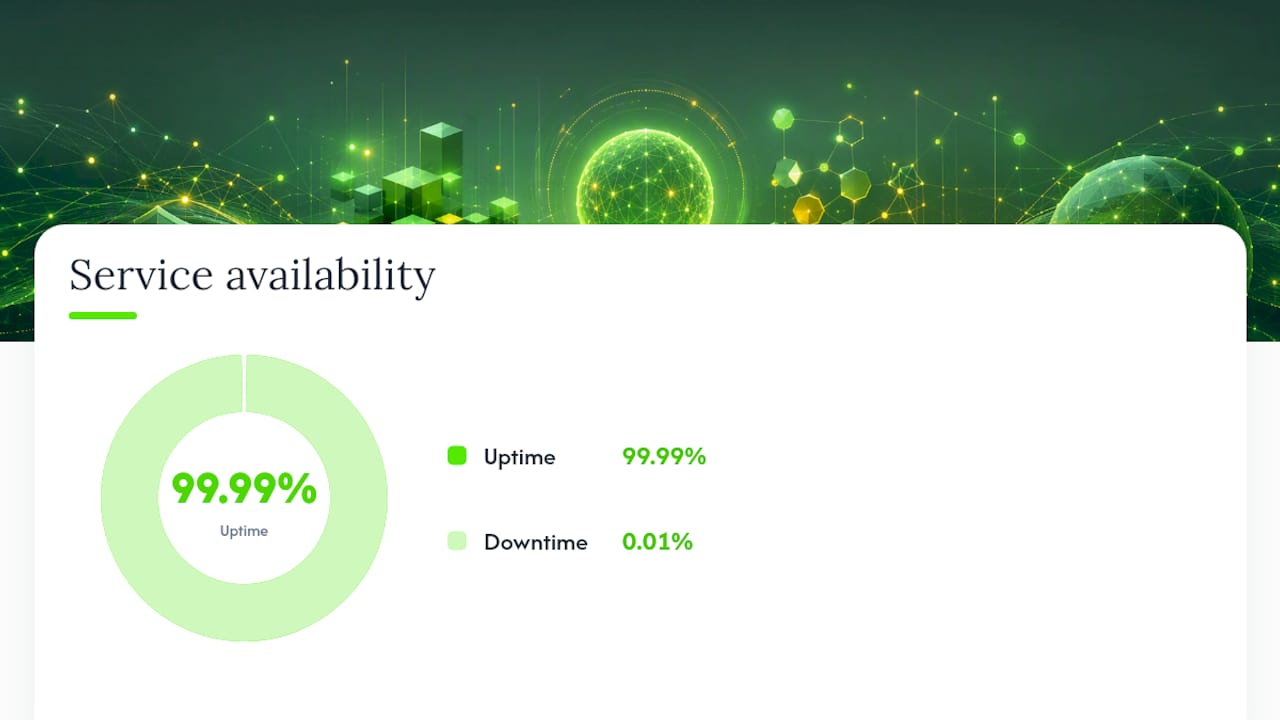
Data point: A well-engineered normalized API can consolidate 200+ sportsbooks and 2,500-plus markets with a roughly 400-millisecond median refresh and a 99.99% uptime SLA. Anything materially slower or less reliable than that benchmark should raise questions about what you’re actually paying for.
Pro Tip: Run your latency test during a chaotic stretch of the game, not the opening minute. Feeds look fine when nothing is happening; the gap shows up the second a book has to reprice fast.
How Predictive Models Turn Live Data Into Probabilities
Behind every live line move sits a model deciding how much a new data point should change the price. Four families dominate: probabilistic models that assign win chances from historical rates, Monte Carlo simulations that run thousands of possible game paths, machine learning ensembles that blend multiple algorithms, and Bayesian updating, which adjusts a prior belief as each new play arrives.
A live-capable model treats every play-by-play event, from a turnover to a red card, as new evidence and recalculates probability within seconds. That’s the difference between a static pregame projection and a system that actually earns the label “real time.”
Model management matters as much as model choice:
- Retraining cadence: stale training data drifts away from current team form and rule changes.
- A/B testing between model versions before fully replacing one in production.
- Drift detection, which flags when a model’s predictions quietly start missing reality.
What should you actually trust from a model’s output? Not a single point estimate. Look for a probability delta (how much the estimate moved) alongside a confidence bound.
The Performance Metrics That Prove You Have an Edge
Win rate alone is a vanity number. It tells you whether you won more than you lost, not whether your process is sound or you got lucky. The metrics that actually separate skill from noise:
| Metric | What it measures | When to use it |
|---|---|---|
| CLV (Closing Line Value) | Whether your bet price beat the closing line | Ongoing, every bet |
| ROI | Net return relative to total wagered | Per strategy or per sport |
| Win rate | Percentage of wagers won | Context only, never alone |
| Sharpe ratio | Return per unit of total volatility | Comparing strategies over time |
| Sortino ratio | Return per unit of downside volatility only | When big losses hurt more than upside helps |
CLV deserves special attention. Experienced bettors track it as a rolling average over roughly the last 100 wagers rather than judging any single bet, since short samples are dominated by variance and live markets frequently overreact to in-game chaos before correcting.
- Bankroll curve: a running plot of unit balance over time, the fastest visual check on trajectory.
- Pareto leak chart: ranks losing categories (bet type, sport, time of day) to show where most of the damage originates.
- Heatmaps: cross-tab performance by market and confidence tier to spot blind spots.
Data point: Bettors who pair CLV trends with bankroll curves and Pareto leak charts convert raw numbers into a decision: scale the strategy, hold steady, or shut it down. Set alerts for model decay, not just for losing streaks, since a model can degrade quietly long before the bankroll shows it.
Checklist for Wiring Live Feeds Into Your Decision Engine
- Secure API keys and confirm rate limits before writing a single line of integration code.
- Subscribe to the SSE or WebSocket stream rather than defaulting to REST polling for anything in-play.
- Normalize the incoming schema so every book’s odds, IDs, and timestamps share one format.
- Deduplicate lines, since the same market often arrives from multiple upstream sources.
- Timestamp every record at ingestion, not just at the source, to catch transit delays.
- Monitor the provider’s health endpoint continuously, not just at setup.
- Automate settlement using stable IDs and automatic grading features where the provider supports them.
Plan for throughput spikes during marquee events and build retries into every connection, since a dropped WebSocket mid-game is worse than a slow one.
Pro Tip: Never build a strategy around a single book’s feed. If that book goes down or delays an update, your model trades on stale data without knowing it.
Turning Analytics Into a Live Betting Strategy
Data means nothing without rules for acting on it. Timing rules should combine your measured per-book latency with your model’s confidence delta. If your feed lags two seconds behind the book’s own repricing, you’re often too late regardless of how sharp your model is.
Sizing should scale with confidence and stay bounded by a pre-set bankroll allocation, never with the gut feeling that follows a big momentum swing. Learn the details of a live-betting strategy anchored to your pregame line for a structured way to size in-game bets.
Event-driven mispricings, an injury, a red card, a VAR review, create short windows before the market catches up. Automating your response to these triggers beats manual reaction every time, because sportsbook algorithms often reprice within seconds.
- Track leaks by category, not just overall ROI, to find where a portfolio is actually bleeding units.
- Treat every live bet as one position in a portfolio, not an isolated event.
What Trust Signals Should You Demand From an AI Betting Provider?
Anyone can claim a winning model. Verification is what separates a real track record from a marketing page.
Before trusting any provider’s numbers, confirm:
- Whether picks are archived permanently and timestamped before the game starts, not edited after the fact.
- Whether grading is public and consistent across wins and losses, not just highlight reels.
- Whether the provider discloses model versions, since a “63% win rate” from eighteen months ago says nothing about the current model.
. A provider willing to show its full archive, wins and losses alike, is telling you more than any single win-rate figure can.
Build Your Own Stack, or Subscribe?
Building an in-house pipeline gives you full control over model logic and data sourcing, but it costs real engineering time, and a two-person team chasing an edge on nights and weekends rarely out-executes a dedicated system. If your team is small, your timeline is short, or your budget can’t absorb months of infrastructure work, buying access to an existing model beats building a worse one slowly.
Pro Tip: Whichever path you choose, validate CLV within your first 100 tracked bets. It’s the earliest honest signal you have.
— Manuel
Get Live, AI-Graded Picks Without Building the Stack Yourself
If reading through latency endpoints and drift detection sounds like more infrastructure than you want to run yourself, A platform with sport-specific AI engines processes live feeds and simulations to generate in-game picks for major sports and is backed by a publicly tracked record of over 1,600 graded picks.

A trial gives you access to live in-game picks generated the same way the tracked record was built, with every pick logged and timestamped rather than edited after the fact. You can also review how the AI engines process daily data before committing to a subscription tier. Start with a trial pass, watch how the picks track against closing lines, and decide from there whether it earns a spot in your rotation.
If you or someone you know struggles with gambling behavior, the National Council on Problem Gambling offers free, confidential support.
Sources
- Sports Betting API — Betstamp
- Live Sports Odds API · Real-Time In-Play Odds over SSE + WebSocket · ParlayAPI
- Performance Analytics for Bettors: Dashboards, CLV, and Drift Detection
- National Council on Problem Gambling