

Correlated Parlays for Bettors: Why 3 Legs Can Be +EV
Correlated parlays can be positive expected value, but only when you spot a linkage the sportsbook hasn’t fully priced. A peer-reviewed analysis of college football betting markets confirms these correlations are real and measurable, while the math breakdown at Wizard of Odds shows why books usually catch up first. Data from tracked picks with a strong win rate suggests the edge lives in a handful of specific, modelable setups, not in stacking random legs together.
TL;DR:
- Correlated parlays can offer an edge only when the linkage is modelable and the market has not fully priced in the correlation, such as weather or role changes.
- Bookmakers measure correlations using historical data and advanced statistical models like the Gaussian copula, which reduces the expected payout on correlated legs.
- Most betting advantages exist in a small set of predictable, well-understood situations; random or post-hoc observations almost always reflect market pricing.
- Staking should be conservative, with smaller Kelly fractions for highly correlated legs, and a maximum of three to four legs per bet to avoid overexposure.
- Building a reliable correlation edge requires a dataset or model, making sports-specific AI tools or disciplined tracking essential for consistent success.
Table of Contents
- What Is a Correlated Parlay, and Why Does Independence Break Down?
- How Sportsbooks Price Correlation
- When Can Correlated Parlays Actually Be +EV?
- A Step-By-Step Framework for Evaluating a Correlated Parlay
- Sport-By-Sport: Where Correlation Actually Shows Up
- Same-Game Parlays vs. Live Betting: Where the Real Limits Are
- Why Manny’s Variety’s Dataset Backs This Framework
- What I’ve Learned Building Correlated Parlays
- Get Data-Backed Picks Without Building the Model Yourself
- Sources
What Is a Correlated Parlay, and Why Does Independence Break Down?
A correlated parlay links two or more bets whose outcomes influence each other, unlike a standard parlay that assumes every leg is independent. That distinction changes the math completely.
For independent legs, you multiply probabilities: P(A) × P(B). If two 50% bets are truly unrelated, your combined odds of hitting both sit at 25%. But if outcome A makes outcome B more likely, the real probability of P(A and B) is higher than that multiplication suggests, and the book’s payout, built on the independence assumption, becomes too generous.
Correlation runs in both directions:
- Positive correlation: a quarterback throwing for 300 yards makes his team’s total points going over more likely.
- Negative correlation: a team leading big at halftime often means the backup runs the ball more in the fourth quarter, working against a passing prop.
- Cross-game correlation: two outdoor stadiums under the same weather system pushing multiple totals in the same direction.
Books treat same-game parlays differently from cross-game combinations precisely because the linkage inside one game is easier to spot and price.
How Sportsbooks Price Correlation
Sportsbooks don’t guess at correlation. They measure it. Correlation matrices track how often specific outcome pairs have historically landed together, and empirical frequency methods pull real game data instead of relying purely on theoretical independence.
The more advanced piece of the toolkit is the Gaussian copula, a statistical method that generates joint probability distributions from separate outcome models. Wizard of Odds explains that copula-based approaches let books estimate how two or three correlated events interact without simulating every possible game state by hand.
The practical result:
- Positive correlation can inflate true joint probability substantially above what independence math predicts, according to Wizard of Odds’ modeling.
- Books respond by shortening the payout, blocking the combination outright, or capping the maximum bet on it.
- The house edge on same-game parlays tends to run noticeably higher than on straight bets, a gap that reflects the pricing risk books absorb when legs interact.
That’s the core information asymmetry. The book has the dataset and the model. You usually don’t, unless you build one yourself.
When Can Correlated Parlays Actually Be +EV?
The edge shows up in one narrow gap: when you’ve modeled a correlation driver that the market hasn’t fully absorbed into its own pricing. Sports Command frames this as intentional versus accidental correlation. Intentional correlation is a linkage you identified and can defend with data. Accidental correlation is a pattern you noticed after the fact, and the market almost certainly priced it already.
Structural patterns worth watching:
- Weather-linked unders across multiple outdoor games kicking off around the same time, before the market fully adjusts totals stadium by stadium.
- Underpriced player-prop pairings, where a specific role change (a new play caller, an injury to a teammate) shifts two related props but the book only updates one.
- Live-line lag windows, where in-game markets take a few seconds to catch up to a play that just happened on the field.
Pro Tip: Track your correlated parlay results in a separate ledger from your straight bets. Small sample sizes make apparent edges look bigger than they are, and a run of three or four wins on a “modeled” correlation can mask what’s actually just variance.
A Step-By-Step Framework for Evaluating a Correlated Parlay
Run every candidate through three filters before you place it.
- Check individual leg EV first. If a leg has no edge on its own, correlation won’t rescue it. Combining two bad bets never produces a good one.
- Compare compound probability to the offered payout. Estimate the joint probability conservatively, using historical frequency for that specific pairing rather than pure independence math. If you lack a large dataset, lean toward the more conservative estimate.
- Run the correlation audit. Ask honestly: is this linkage something I identified and can explain with a specific mechanism (weather, usage, game script), or did I notice it after scanning box scores? Only the first kind holds up.
Staking matters as much as the pick itself. Sports Command’s Kelly Criterion breakdown shows that standard Kelly sizing overstates safe bet size once legs correlate, because it assumes independence in its variance calculation.
Practical staking rules:
- Two legs with a strong, well-documented edge: half Kelly.
- Three legs: quarter Kelly, since your probability estimate carries more uncertainty with each added leg.
- Four or more legs: flat, small stakes only. Treat these as entertainment bets, not investment plays.
Pro Tip: If you can’t explain your correlation edge in one sentence to another bettor, cut your stake in half before you place it.
Sport-By-Sport: Where Correlation Actually Shows Up
Different sports produce different correlation drivers, and recognizing the pattern matters more than memorizing a list.
- NFL: Weather and game script dominate. A team down two touchdowns at halftime is far more likely to abandon the run, which links the halftime line to full-game passing props and the final total. Reviewing NFL player prop strategy helps map which props move together before you build the parlay.
- NBA: Star player minutes drive everything. A star returning from rest changes usage rates for two or three teammates simultaneously, so a moneyline pick and a teammate’s assists prop often move in tandem.
- MLB: A dominant starting pitcher suppresses the run total and makes the run line and the moneyline highly correlated with each other, since one dominant outing usually decides both.
A useful case study: a top quarterback projected for 320+ passing yards against a defense allowing the league’s highest completion rate. That same quarterback’s team going over the team total isn’t a coincidence bet, it’s the same underlying driver expressed twice. The question isn’t whether the correlation exists. It’s whether the book’s prop and total odds already reflect it.
Same-Game Parlays vs. Live Betting: Where the Real Limits Are
SGP builders reprice every leg in real time the moment you add a second one, because the risk engine behind the interface runs the same correlation checks a trader would run manually. That’s why your payout drops the instant you stack a quarterback’s passing yards with his team’s total.
Live betting creates brief, genuine mismatches instead. Lines can lag a few seconds behind a big play, and that window sometimes offers real value, though it closes fast and rewards speed over analysis.
- Keep a separate record of every live-bet correlation attempt so you can see if the pattern holds across dozens of tries, not just a lucky handful.
- Avoid SGPs entirely when a book’s builder shows a payout far below what your own independence math suggests. That gap is the book telling you it already found the correlation.
- Consider hedging a live parlay when an early leg hits and the remaining legs carry real variance.
Pro Tip: Railbird’s piece on betting discipline makes a point worth internalizing: sometimes the most profitable move on a live board is watching the play unfold before you touch the bet slip at all.
Why Manny’s Variety’s Dataset Backs This Framework
Building this evaluation model without a real dataset is guesswork. Sport-specific AI engines can run thousands of simulations per matchup, generating joint-probability estimates similar to those sportsbooks use internally, with results archived publicly rather than claimed after the fact. That order matters more than most bettors realize. Reviewing the same-game parlay strategy breakdown shows how that discipline plays out leg by leg.
What I’ve Learned Building Correlated Parlays
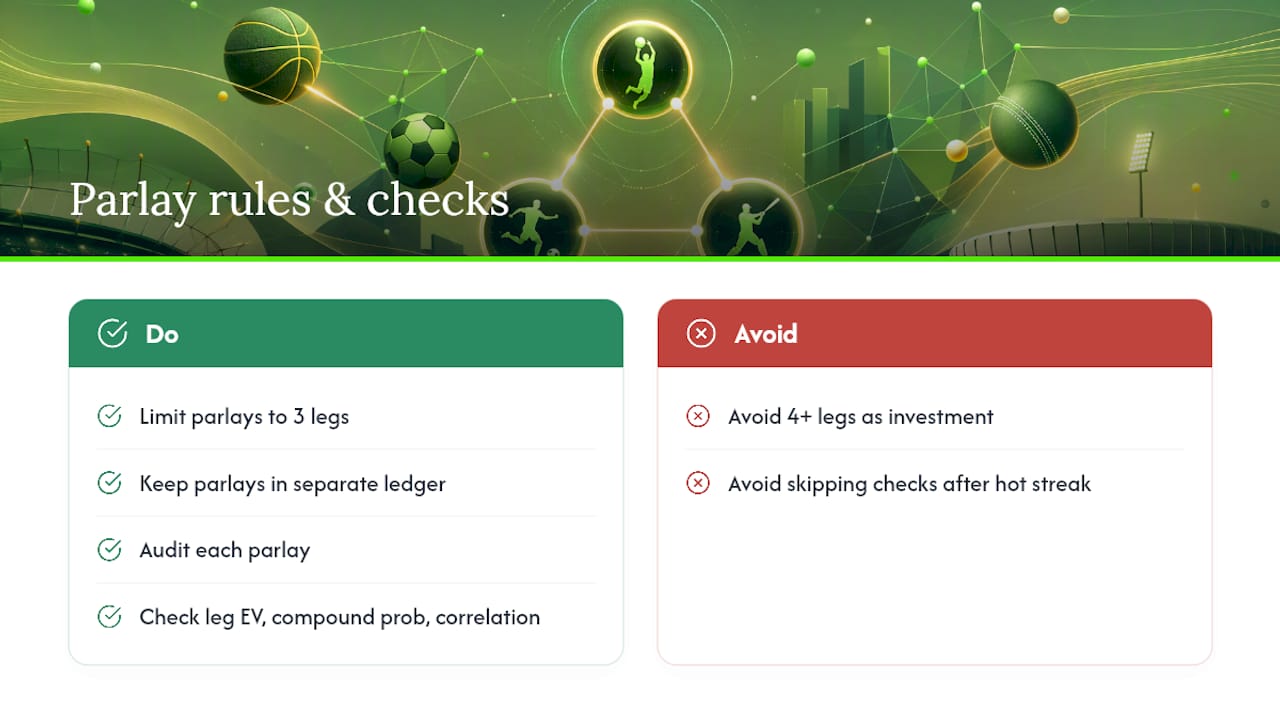
My working rule: three legs is the ceiling for anything I’d call a real investment bet. Four or more legs is entertainment money unless the mispricing is obvious and the correlation mechanism is one I can state in a single sentence.
I keep correlated parlays in a separate ledger from straight bets and single-leg props. That separation forces an honest audit, individual leg EV, compound probability against the payout, and a correlation check, every single time, instead of letting a hot streak talk me into skipping a step.
— Manuel
Get Data-Backed Picks Without Building the Model Yourself
Modeling correlation by hand takes a real dataset, and most bettors don’t have thousands of simulated game outcomes sitting in a spreadsheet. Certain platforms run sport-specific AI engines that perform joint-probability calculations behind the scenes, filtering leg-by-leg edges and parlay signals through a disciplined evaluation framework.

Start by checking the MLB picks page or reviewing the NBA track record to see how the grading holds up over time, since every pick is archived and graded publicly rather than promoted only when it hits. If you want to see how the picks get built before committing to anything, the how it works overview walks through the process, and the live in-game picks page is the practical next step if live-window timing is what drew you to correlated betting in the first place.
Sources
- Same-game parlays: the mathematics of correlation | Wizard of Odds
- Correlated parlay betting: An analysis of betting market profitability scenarios in college football
- Parlay bet guide: what the math actually shows — Sports Command