

Evidence-Based Betting: A Data-Driven Approach That Works
Evidence-based betting is the disciplined process of estimating true probabilities, betting only when the market price offers positive expected value, sizing stakes to bankroll and model uncertainty, and auditing performance through closing-line value. It replaces gut calls with numbers you can check.
Three pillars make this approach work, and each one is verifiable:
- Model calibration — how closely predicted probabilities match real outcomes over time, which matters more for profitability than raw accuracy.
- Positive expected value (EV) — betting only when your fair-odds estimate beats the sportsbook’s implied probability.
- Disciplined stake sizing — using fractional Kelly and hard caps so a string of losses doesn’t wipe out your bankroll.
Those numbers matter less as marketing and more as a public record you can audit yourself.
Key Takeaways
Evidence-based betting works because it replaces gut-feel picks with calibrated probability estimates, disciplined stake sizing, and continuous performance auditing through closing-line value.
| Point | Details |
|---|---|
| Calibration beats accuracy | Calibration-based model selection produced a 34.69% ROI versus a 35.17% loss for accuracy-based selection in NBA tests. |
| Track closing-line value | Recording opening and closing odds on every bet reveals whether your edge is real over a large enough sample. |
| Size stakes conservatively | Use fractional Kelly, often a quarter Kelly capped at 1% to 2% of bankroll, to avoid ruin from estimation error. |
| Validate with walk-forward testing | Backtest only on data after the training window, repeated over time, to avoid overfitting to past results. |
| Manny’s Variety as a working example | Publishes archived records for verification, allowing you to audit its win rate and net units. |
Table of Contents
- What Evidence-Based Betting Actually Means
- Core Principles and Metrics to Insist On
- How to Find, Size, and Track a Bet Step by Step
- Tools and Data Practices That Make This Work
- How Manny’s Variety Applies These Principles
- Managing the Behavioral Risks of Algorithmic Betting
- Adjusting Your Model for Different Sports and Bet Types
- Blending Qualitative Judgment With Quantitative Models
- The Gap Between What Sounds Rigorous and What Actually Works
- Try Manny’s Variety and See the Record for Yourself
- Sources
What Evidence-Based Betting Actually Means
Calibration and accuracy sound similar but measure different things. Accuracy asks “how often was the pick right?” Calibration asks “when the model said 70%, did that outcome actually happen about 70% of the time?” A model can be accurate on easy games and still be poorly calibrated, which is dangerous the moment you use its output to size bets with the Kelly criterion. Research comparing model-selection methods found calibration-based selection produced a 34.69% ROI in NBA simulations, while accuracy-based selection lost 35.17% over the same period.
Expected value is the second concept you need cold. If a sportsbook lists a moneyline at -110, that implies roughly 52.4% probability once you strip the vig.
- Sample size and model uncertainty around that estimate
- Line movement between your bet and kickoff
- The book’s actual margin on that specific market
Out-of-sample and walk-forward validation exist to catch a model that only looks good because it was tuned on the same data it was tested against. Skip that step, and you’re not testing a strategy. You’re testing your own hindsight.
Core Principles and Metrics to Insist On
Before trusting any model output, whether it’s your own spreadsheet or a paid picks service, insist on metrics that can’t be gamed by cherry-picking a hot streak.
Statistic to watch: models selected for calibration over raw accuracy produced a 34.69% ROI versus a -35.17% loss for accuracy-optimized models in the same NBA study cited above. That 70-point swing is the single clearest argument for demanding calibration data, not a win-rate headline, from any source you rely on.
Here’s the checklist worth running against any model or service before you trust it with real money:
- Brier score or log loss, not just win percentage. These proper scoring rules penalize overconfident wrong picks more than accuracy alone does.
- Closing-line value (CLV): the difference between the odds you got and the closing odds. Beating the close consistently is one of the strongest indicators that your edge is real rather than lucky, since the closing line reflects nearly all available market information.
- Walk-forward backtesting: testing a model only on data that came after the training window, rerun repeatedly as new data arrives, rather than one static train/test split.
- Block-bootstrap confidence intervals and deflated Sharpe ratios, which correct for the fact that testing dozens of model variants naturally produces a few that look great by chance. A Kelly-based evaluation framework treats each model as a bettor and uses bankroll growth itself as a real-time credibility metric, which turns out to distinguish genuinely good models from lucky ones better than log loss alone.
- Data freshness and feature-level explainability: can the model tell you why it likes a pick (injury report, pace, travel fatigue), or is it a black box?
- Model decay monitoring: are results tracked continuously so a service can flag when a model’s edge is eroding, rather than quietly going cold?
Any source that can’t produce these on request is asking you to trust a claim it hasn’t shown its work on.
How to Find, Size, and Track a Bet Step by Step
Evidence-based betting is a repeatable process, and you can practice it with paper stakes before committing real money.
- Record the exact market and context. Sport, specific market (spread, total, player prop), sportsbook, and timestamp. Odds move by the minute, so context is data.
- Estimate fair probability. Combine your model’s output with a no-vig baseline pulled from consensus market odds. If three books average -115/-105 on a side, strip the vig to get the market’s implied “true” line before comparing it to your own number.
- Convert sportsbook odds to implied probability, then calculate your edge: your fair probability minus the market’s implied probability.
- Apply a conservative haircut. An edge under roughly 2% is noise. Between 2% and 4% is thin and marginal. Above 4% to 5% is generally playable, and anything above 8% to 10% should raise a red flag worth double-checking, since real, sustained edges that large are rare. This staged filtering approach mirrors the repeatable EV workflow practitioners use to separate genuine value from data noise.
- Size the stake with fractional Kelly. Full Kelly is too aggressive for real bankrolls given estimation error. Quarter Kelly, capped at 1% to 2% of bankroll per bet, is a common conservative standard.
- Check operational conditions before placing the bet. Is the data feed current? Is there enough liquidity at that line to get a full fill?
- Record the closing line after the game locks, then calculate CLV. This single number, tracked over dozens of bets, tells you more about whether your process works than any short-term win/loss record.
Pro Tip: Keep a simple spreadsheet with columns for opening odds, your fair-value estimate, stake, closing odds, and result. After 50 bets, your average CLV will tell you more about your process than your win rate ever will.
Tools and Data Practices That Make This Work
The right tools turn this workflow from a weekend project into something you can sustain. Odds-comparison screens and no-vig calculators let you shop lines and strip market margin fast. A dedicated expected value tracking sheet or app keeps your CLV history in one place instead of scattered across bet slips.
On the modeling side, real value comes from real-time data ingestion, lineup changes, travel schedules, injury reports, refreshed frequently enough that a model isn’t working off stale inputs. Production systems built for this typically retrain or refresh on sub-minute cycles for high-frequency sports like the NBA.
Backtesting deserves the same rigor: walk-forward validation, block-bootstrap intervals, and correction for multiple comparisons when testing many model variants all guard against a strategy that only looks good because you tested a hundred versions of it.
Be skeptical of any service that won’t show its calibration curves or explain a pick’s reasoning. Explainable outputs, not just a confident headline number, are the difference between a tool and a slogan.
How Manny’s Variety Applies These Principles
Manny’s Variety builds its picks with sport-specific AI engines for NBA, MLB, NFL, and other leagues, running real-time analytics and thousands of simulations per matchup rather than a single static projection.
Here’s how that maps to the checklist above:
- Calibration and backtesting: sport-specific engines are built and refreshed against historical outcomes, not a single backtest run once and forgotten.
- CLV transparency: results are archived permanently, so you can compare posted picks against how lines moved afterward.
- Explainability: picks come with context rather than a bare number, letting you see the reasoning behind a play.
- Where to check: the how-it-works page and pick archives are the places to verify these claims against real, dated records rather than a marketing summary.
Managing the Behavioral Risks of Algorithmic Betting
Algorithmic personalization cuts both ways. A PMC study of gambling platform behavior analyzing nearly 447,000 accounts found that bonuses, early cash-out prompts, and profit signals measurably changed how many consecutive bets a person placed, sometimes reducing chasing behavior, sometimes not.
- Set a fixed bankroll percentage per bet and a hard daily loss cap.
- Build in mandatory cool-downs after losing streaks, not just after wins.
- Avoid chasing high-frequency player props purely because they’re available every few minutes.
Pro Tip: Track everything on one account. Splitting action across multiple books to “diversify” also makes it much harder to catch your own bad patterns before they compound.
Adjusting Your Model for Different Sports and Bet Types
A calibration curve built for NFL spreads doesn’t transfer cleanly to NBA player props or MLB totals, and treating them the same is one of the more common mistakes evidence-based bettors make.
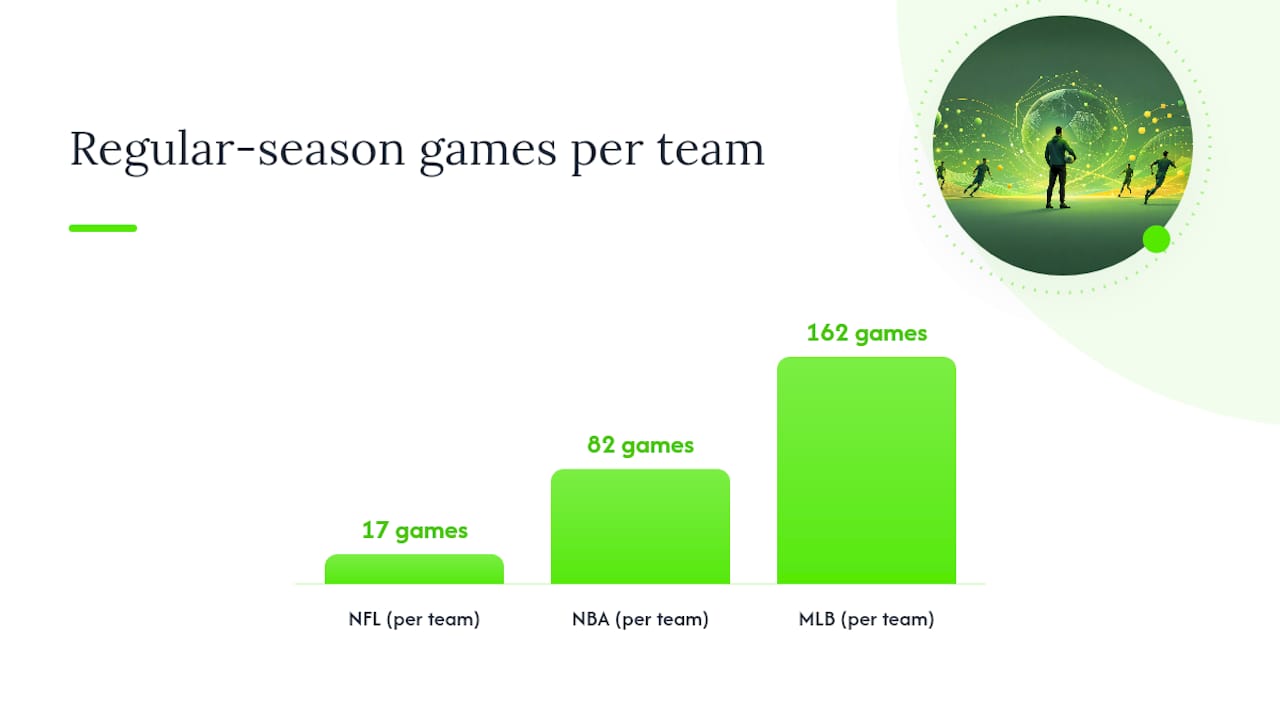
Sample size varies enormously by sport. The NFL plays 17 regular-season games per team, while the NBA and MLB play 82 and 162. That means an NFL model has far less data to calibrate against each season, so wider confidence intervals and smaller stakes are appropriate even when the edge looks similar on paper. NBA and MLB models can lean harder on large-sample statistical patterns, while NFL models need more weight on qualitative context like coaching tendencies and short-week fatigue.
Bet type matters just as much as sport. A moneyline or spread model benefits from decades of established statistical modeling, point differentials, pace, efficiency ratings. Player props require a different data structure entirely: usage rate, minutes projections, matchup-specific defensive metrics, and injury news that can shift a projection within hours. Totals models need their own volatility assumptions, since a slow-paced defensive game and a shootout produce very different variance even at the same average score.
The practical takeaway: don’t run one generic probability model across every market. Build or choose separate calibration checks for spreads, totals, and props within each sport, since a model calibrated well on NFL spreads offers no guarantee it’s calibrated at all on NBA player props.
Blending Qualitative Judgment With Quantitative Models
Pure statistical models miss things that don’t show up cleanly in historical data. A locker room dispute, a quarterback playing through an undisclosed injury, or a coach known for resting starters in low-stakes games are qualitative signals that a number-only model can systematically underweight.
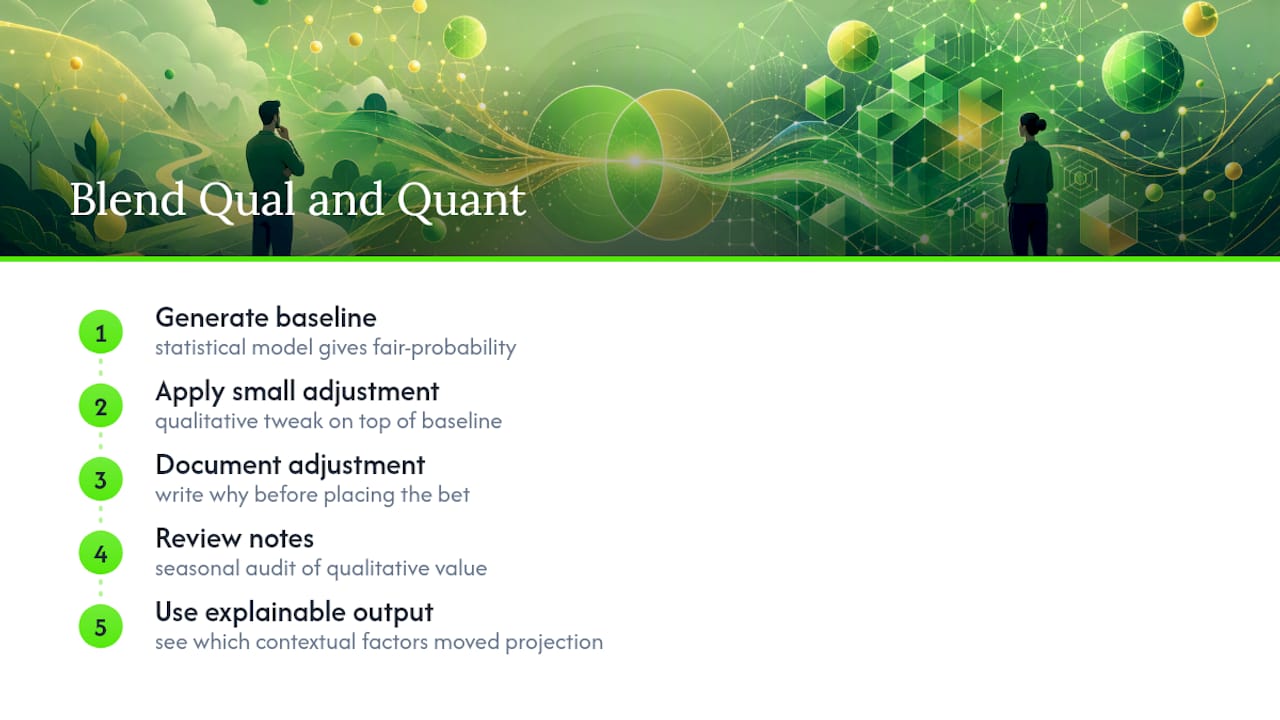
The mistake most bettors make is treating qualitative and quantitative inputs as competitors instead of teammates. The better approach uses your statistical model to generate a fair-probability baseline, then applies a qualitative adjustment layer on top, small, documented, and consistent, rather than an emotional override applied inconsistently from bet to bet.
Practically, that means writing down why you’re adjusting a model’s output before you place the bet, not after. If you’re shading a total down two points because a starting pitcher was scratched, note it. If you’re passing on an otherwise strong spread play because of a coaching change, note that too. Over a season, reviewing those notes tells you whether your qualitative instincts are adding value or quietly bleeding your model’s edge. Manny’s Variety’s sport-specific engines fold contextual factors like lineups and travel into the model itself rather than leaving them to a separate gut check, which is one reason explainable feature-level output matters: you can see which qualitative inputs actually moved a projection.
The Gap Between What Sounds Rigorous and What Actually Works
Most betting content sells “data-driven” as a vibe rather than a discipline. Plenty of services flash a win rate and call it evidence. Win rate alone, without calibration data, without a public and dated track record, tells you almost nothing about whether a model will hold up next month.
The uncomfortable truth is that a well-calibrated model with a modest edge will beat an overconfident, high-accuracy model over a long enough sample, because Kelly-based stake sizing punishes miscalibration hard. That’s the finding from the NBA calibration study worth internalizing: chasing accuracy without checking calibration is how bettors blow up bankrolls while believing their process is sound.
If there’s one thing conventional betting advice underweights, it’s operational reality. A statistically profitable strategy that gets your account limited the moment you start winning isn’t a strategy you can scale. That’s not a reason to abandon rigor. It’s a reason to build in conservative stake sizing and diversified action from the start, rather than discovering the constraint after a book flags your account.
Prioritize this in order: demand calibration and CLV data before anything else, build or choose a workflow you can actually repeat weekly, and treat responsible-gambling controls as part of the strategy, not an afterthought bolted on for compliance.
— Manuel
Try Manny’s Variety and See the Record for Yourself
Manny’s Variety gives you what most picks services won’t: a public, dated archive you can check against how lines actually closed, not just a promised win rate. Every pick across NBA, MLB, NFL, and more leagues is logged permanently, so the calibration and CLV checks this guide walks through aren’t theoretical, they’re something you can verify pick by pick.

Start by reading through the how-it-works page to see exactly how the sport-specific engines generate picks and how the track record gets graded. From there, check the live picks page to see how the model’s output looks in real time, before a line closes, which is the exact moment CLV starts to matter. Compare a handful of archived picks against their closing lines yourself before committing real bankroll, and size whatever you do bet with the fractional Kelly approach covered above.
Sources
- Machine learning for sports betting: Should model selection be based on accuracy or calibration?
- AI personalization and its influence on online gamblers’ behavior - PMC
- Kelly-based evaluation for time-updating probabilistic forecasts (arXiv)
- How to find positive EV bets: A repeatable workflow | BetResearcher