

Most Accurate Fantasy Projections: Consensus First, Position Winners Second
The most accurate fantasy projections come from aggregated consensus outputs, not any single source. Multi-year MAE analyses from Fantasy Football Analytics show the FFA Average outperformed individual sources in a majority of head-to-head comparisons across positions and seasons. Build your baseline from a simple average of multiple projections, then apply these single-source callouts by position:
- Consensus first: Use a simple average of projections from sources like FantasyPros, CBS Sports, NFL.com, FFTODAY, and FantasySharks as your draft and weekly baseline. MAE measured across 3-year and 5-year windows confirms this approach reduces single-source variance more reliably than any one model.
- QB: Consensus leads here. QB error rates have risen in recent seasons due to scheme changes and injury volatility, making any single source unreliable. Stick with the aggregate.
- RB: RTSports and NumberFire have shown strong multi-season RB accuracy. Use one as a tiebreaker when the consensus is tight on a specific back.
- WR: CBS Sports projections and FFTODAY have posted competitive WR MAE figures across multiple seasons. Cross-check both against your consensus number.
- TE: NumberFire has led TE accuracy in select seasons. Given how volatile the position is, treat any single-source TE edge as a one-season signal, not a trend.
Your immediate next step: Pull projections from at least four sources, align them to your league’s scoring format, and average them. That simple consensus is your most defensible starting point for any draft or weekly decision.
Key Takeaways
The most accurate fantasy projections come from aggregated consensus outputs measured by MAE across multi-year windows, with position-specific single-source overrides applied only when a source shows persistent multi-season outperformance at that position.
| Point | Details |
|---|---|
| Consensus baseline wins | The FFA Average outperformed individual sources in a majority of head-to-head comparisons across positions and seasons. |
| MAE over multiple years | Judge any projection source on 3-year and 5-year MAE windows, not single-season rankings that frequently reverse. |
| Position-specific overrides | Use consensus for QB and cross-positional stability; apply single-source overrides at RB, WR, or TE only when multi-season evidence supports it. |
| Update cadence is critical | A projection not updated after Thursday’s injury report is a preseason estimate, not a weekly tool. |
| Mannysvariety daily AI layer | Mannysvariety’s daily-updated AI engines and archived track record let you test a live-data baseline directly against your own consensus projections. |
Table of Contents
- Which projection approach is right for your workflow?
- How projection accuracy is measured
- Position-by-position accuracy: what the data shows
- Why aggregated projections usually beat single sources
- How to use projections in drafts, best-ball, and weekly lineups
- Limitations and red flags to watch for
- Our testing methodology and reproducibility notes
- A note on how projections work in practice
- Mannysvariety gives you a daily-updated AI baseline to test against your consensus
- Sources
Which projection approach is right for your workflow?
Different managers need different tools depending on whether they are drafting, running best-ball teams, or making weekly lineup calls. The table below maps each major projection approach along the dimensions that matter most for fantasy decision-making.
| Approach | MAE rank tendency | Position strengths | Multi-year consistency | Best for | Format & accessibility | Update cadence |
|---|---|---|---|---|---|---|
| Simple consensus average | Top tier across positions | All four positions | High — stable across 3- and 5-year windows | Draft, weekly, best-ball | Free; manual aggregation required | Depends on source refresh rates |
| Weighted consensus average | Near top; vulnerable when past leaders regress | All positions when calibrated | Moderate — degrades if weights are not recalibrated | Draft and best-ball | Free to build; requires historical MAE data | Same as source inputs |
| Single-source algorithmic | Varies by season and position | Position-specific leaders (e.g., TE in select years) | Low to moderate — frequent rank oscillation | Weekly spot plays; positional overrides | Free and paid tiers; CSV/API on some platforms | Daily to weekly in-season |
| Expert-curated rankings | Competitive in-season; weaker preseason | QB and skill positions | Moderate; expert consensus improves with aggregation | Weekly starts/sits; ADP context | Free on major platforms | Weekly; some daily |
| AI platform (e.g., Mannysvariety) | High; driven by daily model updates | Cross-sport; NFL-specific engines | Tracked via archived picks and public win-rate records | Daily picks, props, weekly lineup support | Subscription; daily reports; archived outputs | Daily with real-time data inputs |
The simple consensus and weighted consensus rows share the same source inputs; the difference is how you weight them. Individual sources are discussed by position in the sections below. The AI platform row reflects Mannysvariety’s documented approach: sport-specific engines, daily updates, and a publicly archived track record.
How projection accuracy is measured
Mean Absolute Error (MAE) is the primary metric for evaluating fantasy projection accuracy. It calculates the average absolute difference between a source’s projected fantasy points and a player’s actual fantasy points across a defined sample. A lower MAE means the source’s projections landed closer to reality on average.
Fantasy Football Analytics’ multi-year accuracy research also references two supporting metrics. R² (coefficient of determination) measures how much of the variance in actual scores a projection explains. Mean Error (ME) captures directional bias: a positive ME means a source consistently over-projects; a negative ME means it under-projects. MAE tells you how far off a source is; ME tells you which direction it tends to miss.
Sample rules matter as much as the metric itself. Accuracy analyses typically use multi-year windows (3-year and 5-year are standard) and restrict the sample to the top-N players at each position by projected points, since projecting a fringe backup is a different task than projecting a starter. In-season snapshots taken at the time managers actually needed the projections are more meaningful than retroactive comparisons using end-of-week updates.
A practical evaluation checklist:
- Confirm the analysis covers at least three seasons, not just the most recent one.
- Check that position breakdowns are reported separately (QB, RB, WR, TE), not pooled.
- Verify the top-N rule: how many players per position were included, and were fringe players excluded?
- Look for an update timestamp on each projection snapshot used in the analysis.
- Ask whether the source reports relative MAE (MAE divided by average projected points) alongside raw MAE, since scoring scales differ by position.
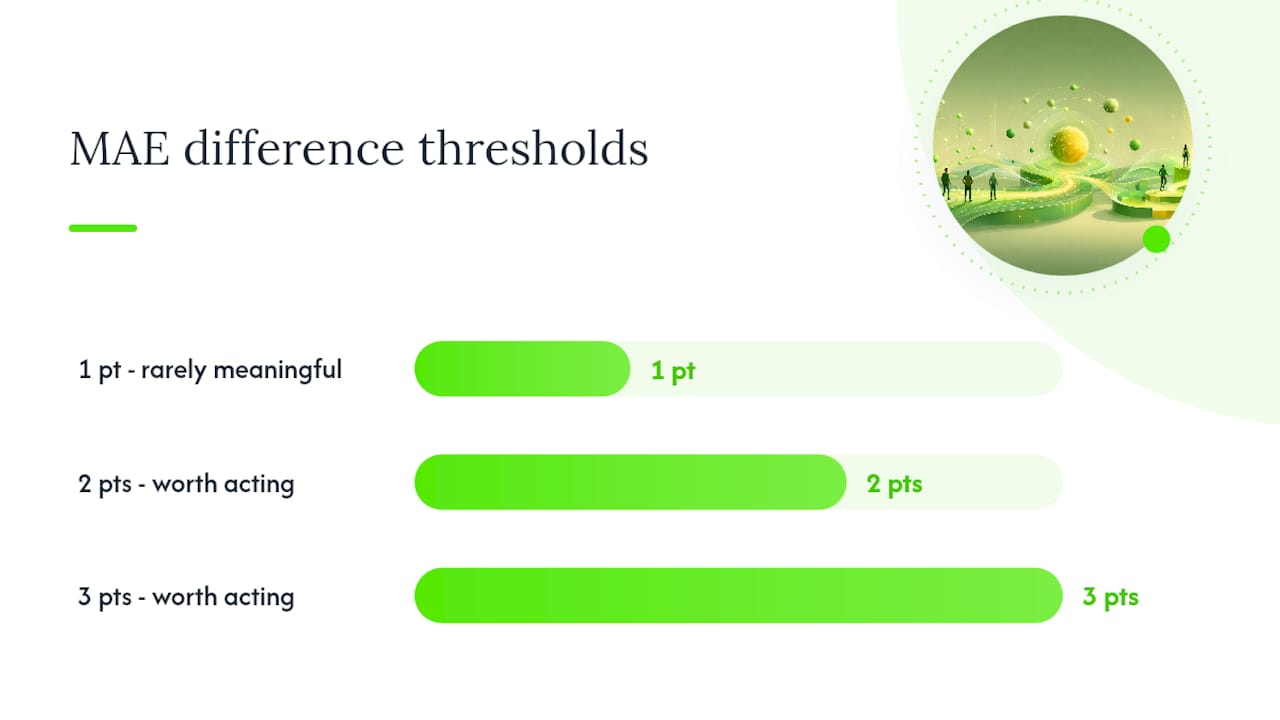
Pro Tip: A one-point MAE difference between two sources is rarely meaningful for a single lineup decision. A consistent two-to-three point gap across three or more seasons at the same position is worth acting on. Small differences in a single season are mostly noise.
Position-by-position accuracy: what the data shows
QB accuracy
Consensus projections are the safest QB baseline. QB error rates have risen in recent seasons, driven by scheme volatility, mid-season coaching changes, and the growing unpredictability of rushing contributions. No single source has maintained a consistent MAE edge at quarterback across multiple years. The aggregate smooths out the individual model blind spots that tend to cluster around mobile QBs and injury replacements.

RB accuracy
Running back projections carry the widest variance of any skill position because workload is the hardest variable to forecast. Snap share, target share, and backfield committee splits can all shift after a single game. RTSports and NumberFire have each posted strong RB accuracy in multi-season analyses, but neither dominates every year. The FFA Average’s consistent top-tier performance at RB reflects this: when workload is uncertain, averaging across models that weight different usage signals produces a more stable output than betting on one model’s assumptions.
Stat note: Across multi-year MAE analyses, the FFA Average outperformed individual RB projection sources in the majority of head-to-head season comparisons, with no single source claiming the top RB spot in more than two consecutive seasons.
WR accuracy
Wide receiver projections tend to cluster more tightly than RB projections because target share is more stable week-to-week than rushing workload. CBS Sports and FFTODAY have posted competitive WR MAE figures across multiple seasons. The practical implication: the gap between the best and worst WR projections is smaller than at RB, so the consensus advantage is less dramatic but still present. Where WR projections diverge sharply, that divergence usually signals a usage or health uncertainty worth investigating before you trust either number.
TE accuracy
Tight end is the most volatile position to project. Touchdown dependency is the core problem: a TE who scores eight touchdowns in a season looks like a projection success story, but those touchdowns are among the hardest individual events to forecast. NumberFire has led TE accuracy in select seasons, but multi-year analyses confirm that TE and WR MAE fields historically compress, meaning the difference between sources is smaller than the position’s inherent volatility. Use the consensus as your floor and treat any single-source TE edge as a one-year signal.
Stat note: TE and WR positions historically show lower absolute MAE than QB and RB in multi-season analyses, but relative error (MAE as a share of average projected points) can be high for TE due to touchdown variance.
Why aggregated projections usually beat single sources
The empirical case for consensus projections is straightforward. Fantasy Football Analytics’ research shows that individual sources frequently change rank year to year: a source that leads QB accuracy one season often regresses the next. No single algorithmic model or expert source matched that consistency.
Three specific benefits drive this result:
- Variance reduction: Each source has its own model assumptions. Averaging across them cancels out idiosyncratic errors that would otherwise inflate your miss rate on a single player.
- Directional bias smoothing: Sources with a consistent over-projection bias (positive ME) are offset by sources that under-project, pulling the average closer to actual outcomes.
- Multi-position reliability: A source that leads at WR may lag at TE. The consensus holds up across positions without requiring you to track which source is currently best at each spot.
How to build a simple consensus in three steps
- Collect projections from at least four sources. Use a mix of algorithmic platforms (NumberFire, CBS Sports, NFL.com projections, FFTODAY, FantasySharks, RTSports, DraftSharks, FantasyPros) to cover different modeling approaches.
- Align all projections to your league’s scoring format. PPR, half-PPR, and standard scoring produce different point totals. Normalize every source to your exact settings before averaging, or the average will be meaningless.
- Calculate a simple average for each player. Sum the projections and divide by the number of sources. That number is your consensus baseline.
On weighted averages: multi-year analyses show that simple averages often outperform weighted versions over long samples because historical source accuracy is not a stable predictor of future accuracy. If you do build a weighted consensus, cap any single source’s weight to avoid overfitting to a historically strong but volatile model. When that source regresses, an uncapped weight amplifies the damage.
How to use projections in drafts, best-ball, and weekly lineups
Draft workflow
Projections are most useful in a draft when combined with ADP and positional scarcity data, not used in isolation.
- Set your consensus projection as the baseline value for each player.
- Flag players where your consensus projection diverges from ADP by more than one round. Those gaps are your value targets.
- Apply positional scarcity adjustments: if your consensus shows a thin WR tier after pick 30, weight WR earlier than raw projections suggest.
- Use DraftSharks’ floor, ceiling, and 3D Value metrics to add risk context to your consensus number. A player with a high ceiling but a low floor needs a different draft strategy than one with a tight range.
Pre-draft validation checklist:
- Confirm projections are updated within 48 hours of your draft date.
- Check that injury designations are reflected in the projection, not just in a separate news feed.
- Verify your scoring format is applied consistently across all sources before averaging.
Best-ball best practices
Best-ball scoring rewards upside, so ceiling matters more than the consensus midpoint. Weight projection sources that show higher variance at WR and TE, since those positions produce the tournament-winning weeks. Use the consensus as a floor check: if a player’s consensus projection is below replacement level, no ceiling argument saves the pick.
Weekly lineup workflow
Real-time data integration changes weekly projection usefulness dramatically compared with static preseason numbers. A projection built on Monday’s injury report is materially different from one built on Saturday’s. For weekly starts and sits:
- Compare your consensus projection against the implied team total from Vegas lines. A high-volume receiver on a team with a 28-point implied total is a different asset than the same receiver on a 17-point total.
- Check snap share and target share trends from the last three weeks, not just the season average.
- Use NFL player props market data as a secondary signal: when the props market and your projection agree, confidence is higher.
- Update your consensus after Thursday’s injury report, not before.
Limitations and red flags to watch for
No projection system eliminates uncertainty. These are the specific failure modes that cost fantasy managers the most:
- Season volatility: A source that ranks first in MAE one season has roughly even odds of ranking outside the top three the next. Single-season accuracy claims are nearly meaningless without multi-year context.
- Small-sample noise: Analyses covering fewer than three seasons or fewer than 20 players per position at the top-N level are too small to draw reliable conclusions from.
- Touchdown-driven TE volatility: TE projections are structurally harder to validate because a handful of touchdowns can swing a season’s MAE dramatically in either direction.
- Model blind spots: Depth chart changes, mid-season trades, and usage shifts after a coordinator change are events most preseason models cannot anticipate. Static projections go stale fast.
- Stale updates: A projection last updated before Week 1 injury reports is not a weekly projection. It is a preseason estimate being used in a live context.
Red-flag checklist for any accuracy claim you encounter:
- No sample size or top-N rule disclosed.
- Single-season results presented without a 3-year or 5-year comparison.
- Missing update timestamps on the projection snapshots used in the analysis.
- Weighting scheme described but not explained or reproducible.
- Position results pooled rather than broken out by QB, RB, WR, and TE separately.
When a source cannot answer basic questions about its methodology, treat its accuracy claims as unverified marketing.
Our testing methodology and reproducibility notes
The accuracy findings in this article draw on publicly available multi-year MAE analyses, primarily from Fantasy Football Analytics, which documents its methodology, season windows, and top-N rules. The framework used:
- Primary metric: MAE (mean absolute difference between projected and actual fantasy points per player per season).
- Supporting metrics: R² for variance explained; ME for directional bias.
- Season windows: 3-year and 5-year rolling comparisons to distinguish consistent performers from single-season outliers.
- Top-N selection: Only top-projected players at each position were included to keep the sample relevant to actual roster decisions.
| Season window | Positions covered | Top-N per position | Scoring basis |
|---|---|---|---|
| 3-year rolling | QB, RB, WR, TE | Top 12 QB / Top 12 RB / Top 12 WR / Top 12 TE | Standard and PPR |
| 5-year rolling | QB, RB, WR, TE | Top 12 QB / Top 12 RB / Top 12 WR / Top 12 TE | Standard and PPR |
Reproducibility notes: Fantasy Football Analytics publishes archived projection data that allows independent replication. To reproduce results, you need time-stamped preseason projection snapshots, not end-of-season retroactive data. Scoring alignment is the most common source of error in DIY accuracy checks: confirm every source is normalized to the same format (PPR vs. standard) before computing MAE. Paper scoring (standard) and PPR produce different absolute MAE values, so comparisons across formats are not valid without normalization.
A note on how projections work in practice
The editorial workflow here follows the same logic the data supports: start with a consensus baseline, apply position-specific overrides only when a source shows persistent outperformance across at least two consecutive seasons at that specific position, and update the consensus after every meaningful injury or usage report during the week.
The honest limitation of any static projection model is that it cannot react to information that emerges after its last update. That gap is where live data integration earns its value. Platforms that incorporate real-time usage trends, AI-driven sports modeling, and daily recalibration close the window between when information becomes available and when it reaches your lineup decision. Testing a live-update platform against your own consensus is a straightforward way to measure whether the added data frequency produces a meaningful accuracy gain for your specific league format.
Mannysvariety gives you a daily-updated AI baseline to test against your consensus
Fantasy managers who build a solid consensus projection still face one persistent problem: the consensus goes stale between updates. Mannysvariety’s sport-specific AI engines recalculate daily, pulling in real-time usage data, injury news, and market signals so your projection baseline reflects what is actually happening, not what was true on Sunday night.

What you get with Mannysvariety:
- Daily NFL projection updates built on thousands of simulations per player, recalibrated as new data arrives.
- Archived pick records with public performance metrics, so you can audit accuracy the same way this article audits public projection sources.
- Custom scoring support so projections align to your league’s exact format, not a generic PPR or standard baseline.
- A documented track record: 63.5% win rate across more than 1,600 tracked picks and 443.9 net units returned, all publicly graded.
To test Mannysvariety against your own consensus this weekend: pull your consensus average on Friday, run Mannysvariety’s daily NFL output for the same player pool, and compare the two sets of projections against actual Sunday results. One weekend of side-by-side data tells you more than any third-party accuracy claim. See how the platform works and start a free trial to run that test at no cost.
Sources
These are the specific resources referenced in this article. Each serves a different part of the accuracy-verification workflow.
- Which Projections Are Most Accurate? - Fantasy Football Analytics
- Fantasy Football PPR Rankings 2026 (Verified Most Accurate)
- Fantasy Football Rankings & Draft Tools 2026 (Fantasy Hype)