
NBA Back-to-Backs: Data, Schedules, and Betting Angles
A back-to-back is two NBA games played on consecutive calendar days, giving players zero recovery time between contests. In the 2025–26 regular season, teams averaged 14.4 back-to-backs per team, with five franchises reaching the league-high of 16 and no team falling below 13. That range matters immediately for anyone tracking performance trends or building a betting model.
Key numbers at a glance:
- League average: 14.4 back-to-back sets per team in 2025–26
- Most back-to-backs: Charlotte Hornets, Denver Nuggets, Philadelphia 76ers, Phoenix Suns, and Washington Wizards (16 each)
- Fewest: Several teams at 13 sets
- Win% impact: Teams playing the second night of a back-to-back typically post lower win percentages, with StatMuse’s no-rest data showing spreads as wide as lower win percentage (Warriors) to higher win percentage (Celtics) in 2025–26
- Where to start: HoopsRumors season tallies, StatMuse queries, and the NBA.com schedule grid are the fastest entry points
Key Takeaways
NBA back-to-backs carry a measurable performance penalty averaging 2–3 points per 100 possessions on night two, but rest differential between opponents is a stronger predictor than raw rest count alone.
| Point | Details |
|---|---|
| League average (2025–26) | Teams averaged 14.4 back-to-backs; five teams reached the high of 16 sets. |
| Rest differential first | Zero rest vs. three days off is a far larger edge than zero vs. one day. |
| Win% varies by team | Celtics posted higher win percentage on no rest; Warriors posted lower win percentage, showing wide team-level variance. |
| Market miscalibration | Elite home teams on night two are often over-faded; road rebuilding teams are under-adjusted. |
| Mannysvariety application | The platform’s NBA engine factors schedule data into daily picks with a strong publicly archived win rate. |
Table of Contents
- How many NBA back-to-backs does each team have in 2025–26?
- Where can you find and filter back-to-back games?
- What does the data show about performance on night two?
- How should bettors use back-to-back data?
- How are back-to-backs counted?
- How have back-to-back totals changed in recent seasons?
- The variable analysts underweight most
- Mannysvariety turns schedule data into daily betting picks
- Sources
How many NBA back-to-backs does each team have in 2025–26?
The full per-team distribution runs from 13 to 16 sets. Five teams sit at the top; most of the league clusters between 14 and 15.
| Team | Back-to-Backs (2025–26) |
|---|---|
| Charlotte Hornets | 16 |
| Denver Nuggets | 16 |
| Philadelphia 76ers | 16 |
| Phoenix Suns | 16 |
| Washington Wizards | 16 |
| Atlanta Hawks | 15 |
| Brooklyn Nets | 15 |
| Chicago Bulls | 15 |
| Cleveland Cavaliers | 15 |
| Dallas Mavericks | 15 |
| Detroit Pistons | 15 |
| Houston Rockets | 15 |
| Indiana Pacers | 15 |
| Los Angeles Clippers | 15 |
| Memphis Grizzlies | 15 |
| Miami Heat | 15 |
| Milwaukee Bucks | 15 |
| Minnesota Timberwolves | 15 |
| New Orleans Pelicans | 15 |
| New York Knicks | 15 |
| Oklahoma City Thunder | 15 |
| Orlando Magic | 15 |
| Portland Trail Blazers | 15 |
| Sacramento Kings | 15 |
| San Antonio Spurs | 15 |
| Toronto Raptors | 15 |
| Utah Jazz | 15 |
| Boston Celtics | 14 |
| Golden State Warriors | 14 |
| Los Angeles Lakers | 14 |
| Miami Heat | 14 |
| New Orleans Pelicans | 14 |
| Boston Celtics | 13 |
Note: Final per-team counts are sourced from HoopsRumors’ 2025–26 back-to-back summary. Individual team totals should be verified against that page, as makeup games and schedule adjustments can shift final counts.
The five teams at 16 sets face a meaningful cumulative fatigue load. Rebuilding rosters like the Wizards and 76ers carry that load with thinner depth charts, which amplifies the on-court effect compared to a team like the Nuggets, who have established rotation players but still absorb the travel burden.
Where can you find and filter back-to-back games?
Four tools cover the full workflow from quick lookup to detailed filtering:
- StatMuse: Type “NBA teams back to backs schedule 2025–26” directly into the search bar. StatMuse returns a game-by-game list with dates, opponents, and rest-day counts. You can narrow by team or date range in seconds.
- HashtagBasketball Advanced Schedule Grid: The grid color-codes rest days by week. Filter by team, toggle the “back-to-back” column, and export to a spreadsheet for tracking rest differentials across a full month.
- Nba: The official source for tip-off times and last-minute rescheduling. Cross-reference here whenever a StatMuse or HoopsRumors count looks off after a postponement.
- HoopsRumors season summary: Best for a single-page overview of per-team totals and league-wide averages at the start of the season.
Pro Tip: Build a simple Google Sheet that pulls the HashtagBasketball grid export weekly. Add a column for opponent rest days alongside your team’s rest days. The differential column — not the raw rest count — is what drives the betting signal.
What does the data show about performance on night two?
Teams playing the second night of a back-to-back tend to perform measurably worse, though the size of the drop depends heavily on context. Research tracking rest-advantage statistics puts the average decline at roughly 2–3 points per 100 possessions on night two, with travel distance and roster depth determining how far a specific team falls from that average.
Stat callout: Teams on zero rest average 2–3 fewer points per 100 possessions compared to their rested baseline, according to betting research tracking multi-season back-to-back trends.
Cross-season studies show the measured effect ranges from roughly 0.5 to 2 points worse on night two depending on the season and methodology. Recent seasons show larger measured drops partly because coaches now rest starters more aggressively, which inflates the statistical gap between rested and unrested lineups.
StatMuse’s 2025–26 no-rest win percentage data illustrates the team-level spread clearly:
The Celtics’ depth and coaching continuity help them absorb back-to-back stress better than most. The Warriors’ number reflects a thinner rotation and heavier reliance on a few key players logging high minutes. Fantasy and box-score delta reports reinforce this heterogeneity: some teams post positive or near-neutral deltas in back-to-back spots, which means treating every zero-rest team as a fade is a systematic error.
Road night-two games compound the effect. A team flying cross-country after a game, then playing the next evening, faces both physiological fatigue and disrupted sleep. Home night-two games are meaningfully less damaging, a distinction that belongs in every pre-game checklist.

Pro Tip: Before assessing a back-to-back spot, check the starter minutes log from night one. A star who played 38+ minutes on night one is a stronger fade signal than one who logged 28 in a blowout.
How should bettors use back-to-back data?
Schedule analysis works best as an overlay on standard handicapping, not a replacement for it. Rest differential is the starting variable, not raw rest count alone. A team on zero rest facing an opponent on three days off is a far larger disadvantage than zero versus one day, as NBC Sports’ schedule breakdown notes when discussing competitive balance considerations.
Pre-game checklist for back-to-back spots:
- Rest differential: How many days does each team have? The gap matters more than the absolute number.
- Travel miles: Cross-country trips on night one amplify fatigue on night two.
- Key player minutes (night one): Stars at 35+ minutes are a meaningful signal; bench-heavy blowouts are not.
- Roster depth: Teams with 8–9 reliable rotation players absorb back-to-backs better than 6-man rotations.
- Home vs. road: Night-two road games carry a larger performance penalty.
- Line movement: Check where the spread opened and where it sits at tip-off. Significant movement toward the rested team suggests sharp money already pricing the fatigue.
Where the market tends to miscalibrate: elite teams on night two at home are frequently over-faded. Sportsbooks and the public both apply a fatigue discount that elite rosters often don’t deserve, particularly when the night-one game was low-minutes. Rebuilding teams on the road on night two are often under-adjusted, especially when their night-one game was a hard-fought loss with heavy star minutes.
Specific angles worth tracking:
- Spread fade on road night-two teams against rested home opponents with a rest differential of two or more days
- First-half totals tend to show the fatigue effect most clearly, since tired teams start slow before adrenaline and crowd noise level the second half
- Backing rested teams on the moneyline when the spread is within three points and the rested team is at home
Pro Tip: Place back-to-back-driven bets as early as possible after the night-one result is final. The market adjusts fastest in the first two hours after tip-off of game one, and the sharpest lines are often available in that window before public money moves them.
How are back-to-backs counted?
A back-to-back is defined as two games on consecutive calendar days, meaning zero days of rest between contests. A team playing Monday and Tuesday has one back-to-back set regardless of whether those games are home, road, or split. Multi-game road trips that include consecutive-day games count each consecutive pair as one set.
Sources used for the 2025–26 counts in this article:
- HoopsRumors season summary (primary count source)
- StatMuse team schedule queries (verification and win% data)
- NBA.com official schedule (tip-off times and rescheduling updates)
Edge cases and exclusions:
- Makeup games: Rescheduled games are counted if they fall on a consecutive day relative to the team’s next scheduled game after rescheduling.
- Neutral-site games: Counted as standard games for rest purposes; travel distance may differ but the calendar-day rule applies.
- Time-zone effects: Not adjusted in standard counts. A West Coast team playing a 10:30 PM ET road game followed by a home game the next night has a shorter effective rest window than the calendar suggests, but official counts treat both as one back-to-back set.
- In-season tournament games: Counted the same as regular-season games for back-to-back purposes.
How have back-to-back totals changed in recent seasons?
The league has reduced back-to-back frequency substantially since the mid-2010s. Key trend markers:
- The 2014–15 season averaged roughly 19–20 back-to-backs per team, nearly six more than the 2025–26 average of 14.4.
- Post-COVID seasons saw schedule compression that temporarily pushed counts back up before normalizing.
- The 2025–26 schedule reflects a continued reduction effort, with no four-games-in-five-nights stretches anywhere in the league calendar.
Scheduling priority: The NBA explicitly removed all four-in-five-night stretches from the 2025–26 schedule, a direct response to player health concerns and competitive balance pressure from team medical staffs.
The 82-game season packed into roughly 170 calendar days makes some back-to-back compression unavoidable. The league’s scheduling algorithm now prioritizes eliminating the most extreme clusters first, which is why four-in-five stretches are gone while two-in-two sets remain common. Season length, not scheduling negligence, is the structural driver.
The variable analysts underweight most
The single most common mistake in back-to-back analysis is treating rest as a binary: rested or not. Rest differential is the actual signal. A team on zero rest against an opponent on one day of rest is a marginal disadvantage. That same zero-rest team against an opponent on four days of rest is a structurally different situation, and the market often prices both the same way.
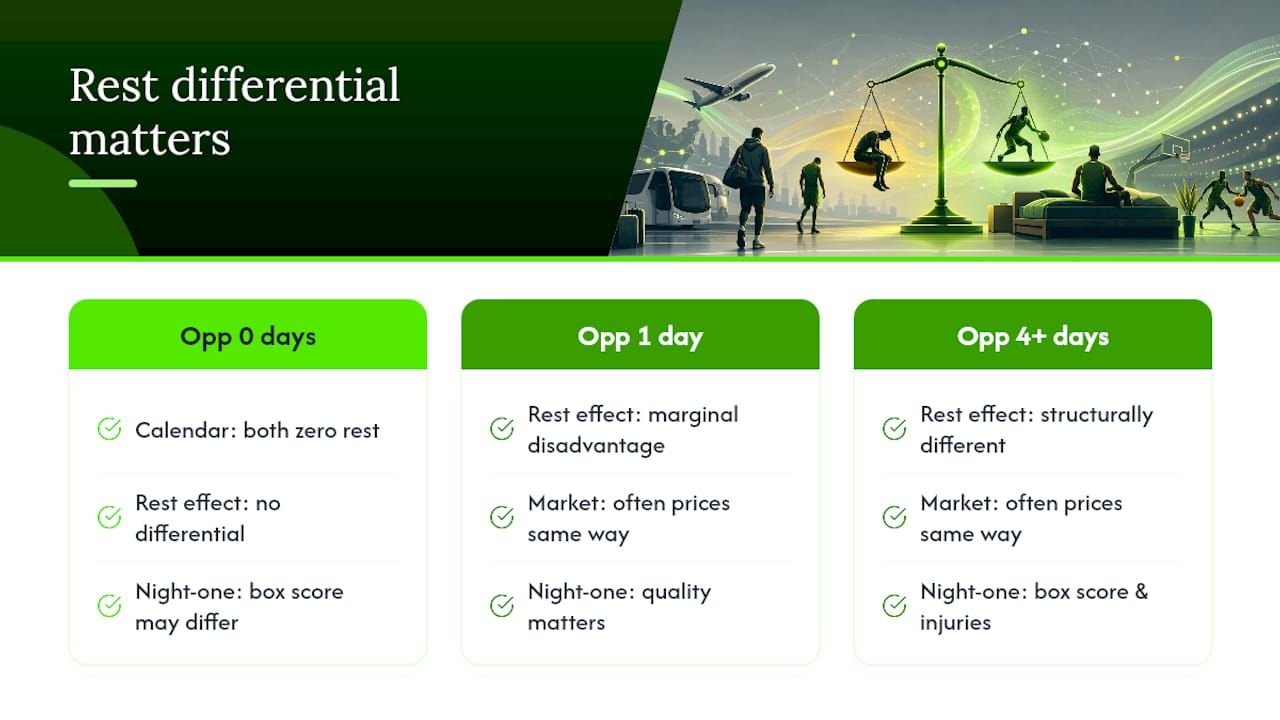
The second underweighted variable is night-one game quality. A team that won by 22 points in 28 minutes of starter play on night one is not the same as a team that survived overtime. The calendar says both are on zero rest. The injury report and the box score tell a different story.
Avoid the reflex of fading every back-to-back team on the spread. The data shows the effect is real but modest on average, and team-level variance is wide enough that mechanical fading loses money over a full season. Use the checklist, weight the differential, and treat schedule as one input among several.
Mannysvariety turns schedule data into daily betting picks
Back-to-back analysis is only as useful as the speed at which you can act on it. Mannysvariety’s AI-powered platform processes rest differentials, travel data, and player minute logs alongside thousands of Monte Carlo simulations to generate daily picks across NBA spreads, moneylines, totals, and player props.

The platform’s NBA predictive engine incorporates schedule variables automatically, so you don’t need to build your own spreadsheet model from scratch. Every pick is archived with a public grade, giving you a verifiable track record rather than a marketing claim.
For bettors who want the back-to-back checklist applied to live lines every day, see how the platform works and review the pick archive before subscribing.
Sources
These resources cover the full range from official schedules to betting-focused analysis:
- NBA Teams Average 14.4 Back-To-Backs In 2025/26
- NBA Teams Win Percentage On Back To Back Games This Season | StatMuse
- NBA Back to Back Betting: Rest Advantage Statistics & Trends
- NBA Back-to-Back Games Fantasy Data Reports