

NBA Rest Advantage: What Bettors Need to Know
Rest advantage matters most in road back-to-back spots, 3-games-in-4-days sequences, and any game where one team has crossed more than 1,000 miles the night before. The edge is real but narrow, and the market prices much of it. Your job is to find the sliver it misprices.
- Teams on the second night of a road back-to-back show measurable declines in shooting efficiency and defensive rebounding — KPIs that move before the final margin does.
- The Relative Rest Index (RRI) outperforms simple categorical rest-day buckets in predictive models; watch RRI bands between 0.5 and 2.0 for meaningful performance shifts.
- Back-to-back games and time-zone crossings carry some of the largest negative schedule coefficients in regression analyses of team net rating.
- Pre-game rule: require at least a 2.0-point schedule-adjusted edge before committing to a rest-based wager. Anything less gets absorbed by the spread.
Key Takeaways
The NBA rest advantage produces a real but narrow betting edge, concentrated in road back-to-back spots and 3-games-in-4-days sequences where travel distance compounds the fatigue penalty.
| Point | Details |
|---|---|
| Road B2B is the top spot | Road back-to-backs with 1,000+ miles of travel carry the largest negative schedule coefficients in net-rating models. |
| Use AED and RRI together | AED corrects for opponent strength; RRI’s 0.5–2.0 band identifies actionable rest differentials before the market fully prices them. |
| KPIs move before margin does | Shooting efficiency, defensive rebounds, and steals degrade on short rest, making prop and totals bets more precise than spread bets alone. |
| Require a 2.0-point edge minimum | Rest-based wagers need at least 2.0 points of schedule-adjusted edge to survive market noise and standard line movement. |
| Mannysvariety applies these filters | Mannysvariety’s NBA engine runs AED, RRI, and travel adjustments on every pick, with sample-size guardrails and lineup overlays built in. |
Table of Contents
- What is the NBA rest advantage and how is it categorized?
- Which in-game KPIs actually change with rest?
- How do sportsbooks price rest, and where are the edges?
- AED and RRI: the two metrics that make rest analysis precise
- Pre-game checklist: applying rest advantage to a single bet
- Case studies: when rest advantage changed the outcome
- When rest signals fail: caveats and common pitfalls
- How this article measures rest and what data sources were used
- How Mannysvariety uses rest advantage in its models
- Mannysvariety picks already factor in rest and schedule metrics
- An honest read on rest advantage betting
- Sources
What is the NBA rest advantage and how is it categorized?
Rest advantage is the rest differential between two opponents, not the absolute number of days either team has had off. A team with two days of rest playing a team on a back-to-back has a meaningful structural edge. A team with four days of rest playing another team with three days has almost none.
Analysts code rest situations using X/O scheduling patterns, where X marks a game day and O marks a rest day. The standard categories are:
- B2B (back-to-back): Second night of consecutive games. The most studied and most consistently impactful category.
- 3IN4: Three games in four days. Research finds this is one of the few extreme scheduling events with reliable aggregate effects.
- 1-day rest: One full day between games. Partial recovery; effects are smaller than B2B.
- 2-day rest: Considered baseline normal recovery for most NBA players.
- 3+ days rest: “Fresh” status. Can produce rust effects in some teams, particularly those reliant on pace and rhythm.
The shorthand “tired vs. fresh” maps directly to these categories. NBAstuffer’s rest-day splits publish team-level win percentages and Adjusted Efficiency Differential (AED) for each category, making them the standard starting point for any rest-based analysis.
Which in-game KPIs actually change with rest?
Final margin is a noisy signal. The cleaner signal lives in specific box-score metrics that degrade under schedule fatigue before the scoreboard reflects it.
Fatigue research published in Frontiers in Psychology identifies shooting efficiency, defensive rebounding, and steals as the KPIs most reliably affected by short rest. Three-point accuracy drops on back-to-backs, which compounds quickly in today’s pace-and-space offenses. Turnover rates tend to rise as decision-making slows under physical fatigue. Defensive intensity, measured through steals and deflections, falls off at a rate that often precedes a cover failure.
Statistic callout: Betting-focused trackers report teams on the second night of a back-to-back underperform by roughly 2–3 points per 100 possessions versus well-rested opponents, before accounting for travel.
A 2025 multi-factor study found that time-zone acclimation negatively influenced mood and certain performance metrics, and that defensive output varied with both elevation and 5-day cumulative training load. Eastward travel is harder on players than westward travel, a detail most casual bettors ignore.
Pro Tip: Weight KPI sensitivity by team identity. A pace-heavy team that relies on transition offense loses more from fatigue than a half-court, post-up team. A defense-first team with deep rotation absorbs back-to-backs better than a star-dependent squad logging 38+ minutes per night.
How do sportsbooks price rest, and where are the edges?
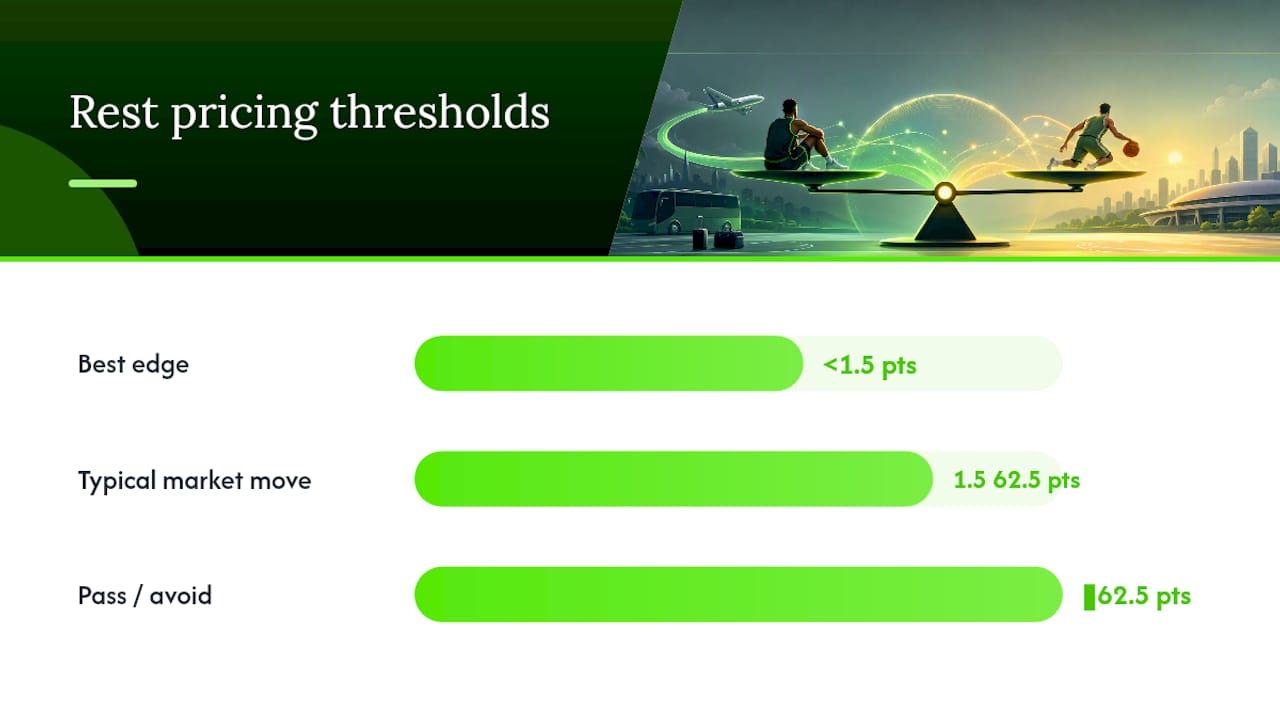
Books adjust spreads and totals for back-to-backs, but the adjustment is rarely precise. The market tends to move 1.5–2.5 points for a standard road B2B, which is often close to fair value. The mispricing happens at the edges: home B2Bs, 3IN4 spots, and games where travel distance compounds the fatigue.
Common betting angles:
- Fade tired teams on the spread: Road B2B with 1,000+ miles traveled the night before is the highest-conviction spot. The spread adjustment frequently lags the actual performance gap.
- Totals under on back-to-backs: Pace slows, shooting efficiency drops, and both teams in a B2B-vs-rested matchup often produce fewer possessions. The under has historically been the more consistent rest-based total play.
- Player props: A star logging 40 minutes on night one is a candidate for reduced three-point attempts or lower assist totals on night two. Minutes from the previous game are a direct input for prop modeling.
- Line movement timing: Monitoring how lines move in the 24–48 hours before tip-off shows when sharp money has already priced the rest spot. If the line has moved 2+ points toward the rested team, much of the edge is gone.
Check real-time odds boards to see how the market is currently pricing specific rest matchups before committing.
Pro Tip: The best rest-based spread bets come when the book’s adjustment is under 1.5 points for a road B2B with 1,000+ miles of travel. That gap between market price and expected performance differential is where the edge lives. If the line has already moved 2.5+ points, pass.
AED and RRI: the two metrics that make rest analysis precise
Adjusted Efficiency Differential (AED)
AED corrects raw point differential for opponent strength and home/away location. A team outscoring opponents by 8 points per 100 possessions at home against weak competition looks very different from a team posting the same number on the road against playoff teams. AED strips that noise out. NBAstuffer publishes AED splits by rest category, so you can see directly how a team’s efficiency changes from 3+ days of rest to B2B situations.
Relative Rest Index (RRI)
RRI scores rest on a continuous scale rather than forcing teams into discrete buckets. Research shows this continuous scoring improves predictive models over simple categorical assignments. Practitioners watch RRI bands between 0.5 and 2.0 as the range where performance shifts become meaningful. Below 0.5, the rest differential is too small to act on. Above 2.0, the market has usually already priced the advantage fully.
How to use them together
- Pull the team’s AED split for the relevant rest category from NBAstuffer.
- Calculate RRI by dividing the rested team’s days off by the tired team’s days off (e.g., 3 days vs. 1 day = RRI of 3.0; flag for market saturation).
- Apply a travel multiplier: add 0.5–1.0 points to the AED adjustment if the tired team crossed 1,000+ miles the previous night.
- Cap the total rest-based point adjustment at 2.5–3.0 points per team to avoid overweighting schedule context.
- Require a minimum of 2.0 points of schedule-adjusted edge before placing the bet.
Pre-game checklist: applying rest advantage to a single bet
Run through these steps in order before placing any rest-based wager:
- Determine the rest differential. Count exact days off for each team. Note whether either team is on a B2B or 3IN4 sequence.
- Pull AED splits. Check each team’s AED by rest category on NBAstuffer’s rest-day stats page. A team with a large AED drop on B2Bs is a stronger fade candidate than one that holds steady.
- Calculate RRI. Divide rested team’s days off by tired team’s days off. Act only in the 0.5–2.0 band for spread bets; above 2.0, the market has likely priced it.
- Apply the travel heuristic. If the tired team traveled 1,000+ miles the previous night, add 0.5–1.0 points to your adjustment. Factor eastward travel and altitude separately. Travel distance and time-zone crossings carry some of the largest negative schedule coefficients in the literature.
- Check home-court and altitude. A rested home team against a road B2B opponent is the highest-conviction scenario. Altitude (Denver, Utah) adds a measurable defensive performance penalty for visiting teams.
- Review the injury and lineup report. A tired team missing its primary ball-handler has compounded fatigue effects. A rested team missing two starters may neutralize the rest edge entirely.
- Check minutes from the previous night. Stars logging 38+ minutes on night one are prop targets and spread modifiers. Bench-heavy rotations absorb fatigue better.
- Compare your adjusted line to the posted spread. Require 2.0+ points of schedule-adjusted edge. Less than that, and market noise erases the advantage.
Pro Tip: Discard the rest signal entirely when the tired team has a deep rotation (9+ meaningful contributors), the star player logged under 32 minutes the previous night, or the rested team is coming off a 5+ day layoff with a history of slow starts after long breaks. These filters cut false positives significantly.
Lock lines 24–48 hours before tip-off when rest-based edges are clearest. By game day, sharp money has usually compressed the spread toward fair value.
Case studies: when rest advantage changed the outcome
Season-level aggregate: road B2B performance splits
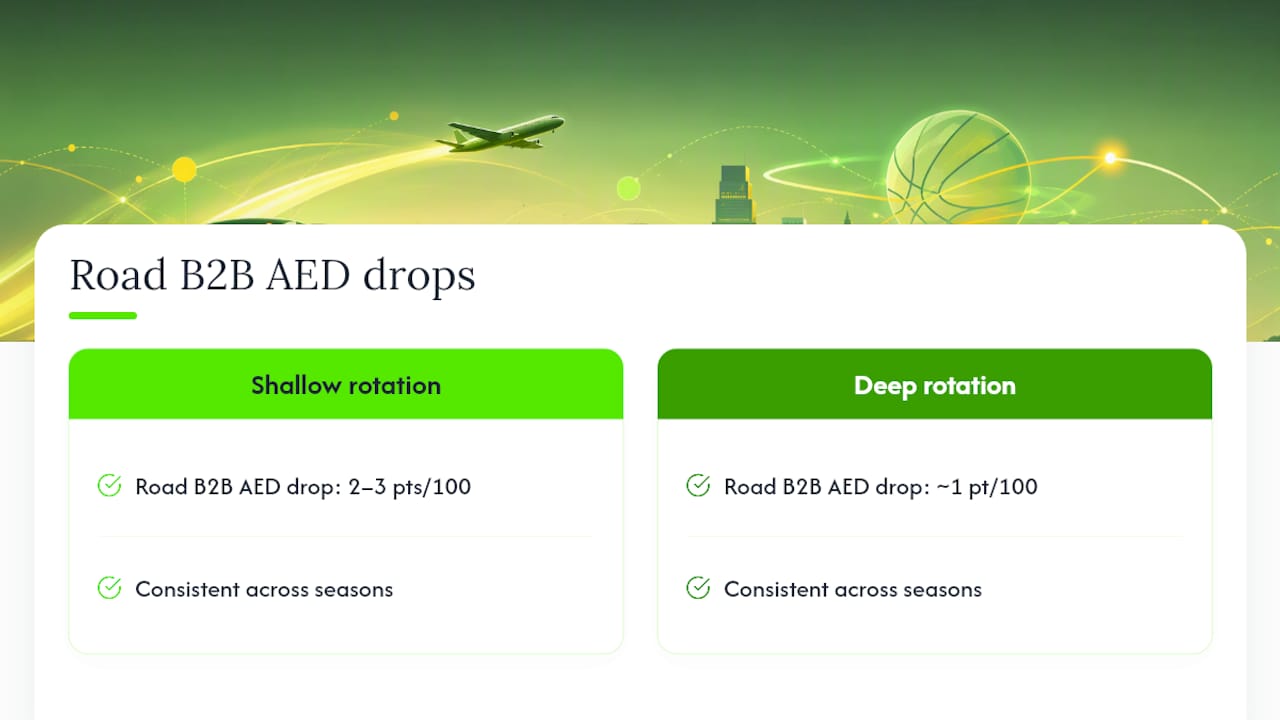
NBAstuffer’s schedule rest-days analysis consistently shows teams posting meaningfully lower AED on road B2Bs compared to games with 2+ days of rest. Across multiple seasons, the pattern holds: road B2B AED drops of 2–3 points per 100 possessions are common for teams with shallow rotations, while deep-rotation teams show drops closer to 1 point. The practical implication is that team identity determines how much of the categorical rest penalty actually materializes.
Single-game example: road B2B with long travel
Consider a scenario where a Western Conference team plays in Miami on a Tuesday night, then travels to Denver for a Wednesday game. The tired team crosses roughly 2,000 miles eastward, gains altitude, and faces a rested home team. Regression analyses show back-to-back and time-zone crossing coefficients are among the largest schedule effects in net-rating models. In this configuration, a spread that opens at 4.5 points in favor of Denver may represent genuine value, particularly if the tired team’s AED on B2Bs is already negative and their star logged 39 minutes the night before.
- The rest differential is maximum (B2B vs. 2-day rest).
- Travel distance exceeds 1,000 miles with eastward time-zone shift.
- Altitude adds a defensive performance penalty for the visiting team.
- AED splits confirm the tired team underperforms in this exact rest category.
These four factors converging is the highest-conviction rest-based betting scenario the schedule produces.
When rest signals fail: caveats and common pitfalls
Rest advantage is frequently overstated. A league-wide analysis found that cumulative fatigue has minimal average impact except for extreme scheduling events like 3IN4 sequences, and that load-management effects are ambiguous in short windows. That finding should temper confidence in any single rest-based bet.
Common failure modes:
- Small samples: A team’s B2B record through 10 games is noise. Require 30+ games in a rest category before treating a split as signal.
- Opponent strength confounding: A tired team playing a weak opponent may cover easily. AED corrects for this; raw win% does not.
- Market pricing: Books have access to the same schedule data you do. Standard B2B spots are often efficiently priced. The edge lives in compound scenarios, not simple categorical bets.
- Load management: Star players resting on the first night of a B2B means the second night’s “tired” team may actually be fresher than the schedule suggests.
- Post-All-Star rust: Teams returning from the All-Star break with 5+ days off sometimes underperform despite rested status, particularly in pace-dependent systems.
- Star-minute variance: A player who logged 28 minutes the previous night is not meaningfully fatigued. Minute thresholds matter more than the B2B label alone.
Statistic callout: The arXiv fatigue study found that many individual fatigue metrics produce small or non-significant effects in aggregate analyses, with reliable signals appearing only in extreme cases like 3IN4 scheduling.
Before risking money on a rest-based rule, backtest it across at least two full seasons with your exact filters applied. A rule that looks profitable on raw B2B records often disappears once you control for opponent strength, home/away, and travel distance.
How this article measures rest and what data sources were used
- AED calculation: — Adjusted Efficiency Differential corrects raw point differential for opponent strength and home/away location. Team-level AED splits by rest category are pulled from NBAstuffer.
How Mannysvariety uses rest advantage in its models
Rest differential is one of several schedule-context inputs in Mannysvariety’s NBA predictive engine. The model applies AED splits by rest category, weights them against RRI bands, and adds a graduated travel multiplier for games where the tired team crossed 1,000+ miles. Player-minute data from the previous night feeds directly into the fatigue adjustment, so a star logging 38+ minutes on night one produces a larger model penalty than a player who logged 28.
The model also applies sample-size guardrails: rest-based adjustments are capped at 2.5–3.0 points and only activate when the team’s rest-category split meets a minimum game threshold. Injury reports and lineup changes are layered in after the schedule adjustment, because a rest edge can be neutralized quickly by a missing starter.
For bettors who want to see how these factors combine in practice, the NBA AI predictions blog walks through the model logic, and the how it works page explains the full predictive engine, including how rest, matchup, and travel factors feed into daily picks.
Mannysvariety picks already factor in rest and schedule metrics
Mannysvariety’s daily NBA picks incorporate AED, RRI, and travel heuristics before a pick is published. Subscribers receive picks that have already passed the checklist in this article: rest differential checked, travel distance applied, lineup and minute data reviewed, and a minimum schedule-adjusted edge required.

What subscribers get: daily picks across spreads, totals, and player props; parlay combinations built on correlated schedule edges; and a permanent archive of every pick with public grading.
Start with the daily picks and predictive engine to see how rest-aware modeling works in practice. Past results do not guarantee future returns.
An honest read on rest advantage betting
The conventional wisdom treats back-to-back games as automatic fade opportunities. That framing is too simple, and it costs bettors money.
The real signal is compound: rest differential plus travel distance plus lineup context plus market pricing. Any one of those factors alone is close to noise. The arXiv fatigue study makes this clear: aggregate fatigue effects are small except in extreme cases. What that means practically is that a standard B2B with no travel, a deep rotation, and a star who logged 30 minutes the night before is not a strong betting signal. The market has already priced it, and you are not finding an edge.
The spots worth targeting are the ones where three or four factors stack: road B2B, 1,000+ miles traveled, star with heavy minutes, and a spread that has moved less than 2 points toward the rested team. Those scenarios are rarer than most bettors expect, which is exactly why they retain value. Discipline in filtering is what separates a sustainable rest-based model from a losing one.
Mannysvariety’s approach reflects that discipline. The model does not flag every B2B as a betting opportunity. It requires the compound scenario, the minimum edge threshold, and the lineup confirmation before a pick goes out. That is the right framework, and it is what the research actually supports.
Sources
- 2112.14649 Tired of Misattribution, Modeling Player Fatigue in the NBA
- Frontiers in Psychology — fatigue and performance (2021)
- Relative Rest Index influences team performance and game
- NBA Rest Days Stats (Only in NBAstuffer)
- Travel fatigue and NBA performance (Bryant University working paper)
- Effect of travel and training load on NBA performance (2025 DOI)