
NHL Back to Backs: Bettors’ 7 Point Rest Score to Spot Mispriced Bets
Back-to-back games, when a team plays on zero days of rest after the night before, consistently tilt outcomes against the short-rest club and open real betting value. Road favorites see their win rate jump when the home team is on the second leg, totals trend toward overs, and backup goalies enter more often than casual bettors realize. The rest of this piece breaks down the counts, the numbers, and a repeatable way to score the disadvantage before you bet it.
TL;DR:
- Teams on the second night of a back-to-back, especially with cross-country travel, face a significant performance decline compared to well-rested opponents.
- Backup goalies are more common on the second night, which impacts save percentage and shot props; lineup and goalie confirmation are key betting signals.
- The rest-disadvantage is more pronounced in early and late season, with travel distance and time zones exacerbating fatigue effects, especially in cross-time-zone trips.
- Using simple scoring based on game rest, location, travel, and goalie status helps identify high-value betting opportunities in back-to-back NHL matchups.
Table of Contents
- What counts as an NHL back-to-back?
- Which teams play the most back-to-backs, and why it matters
- How back-to-backs move the numbers: points, scoring, and goalies
- Betting angles: turning rest data into wagers
- How to build a quick back-to-back score for any matchup
- What the history books say about back-to-back trends
- Travel distance and time zones make fatigue worse
- Star players and depth lines don’t feel fatigue the same way
- How teams actively manage back-to-back fatigue
- Injury risk climbs on the second night
- Combining back-to-backs with other situational factors
- Manny’s Variety perspective: how we use rest-edge signals in practice
- Get rest-adjusted NHL picks without building the model yourself
- Sources
What counts as an NHL back-to-back?
A back-to-back is any game played on zero days of rest, meaning a team suits up on consecutive calendar nights with no day off between. That’s the working definition sportsbooks and schedule analysts use, and it’s the one that matters for betting purposes because it’s the only rest category with a consistently measurable performance gap.
Not every back-to-back looks the same. A team playing home to home deals with almost no added stress beyond fatigue itself. Away to home, or home to away, adds travel logistics on top of the short turnaround. The worst version is back-to-back road games in different cities, sometimes across time zones, which stacks travel fatigue on top of game fatigue. Bettors who lump all back-to-backs into one bucket are missing a real distinction.
The NHL has trimmed the number of back-to-backs over the years as part of broader schedule reform, largely in response to player health advocacy and the league’s own data on injury risk and performance dips. Season length and calendar structure still drive how many crops up in a given year. The 84-game format discussed for the 2026-27 season changes how condensed the calendar gets around holidays and All-Star breaks, which in turn shifts how many zero-rest nights teams absorb and when.
Here are the schedule terms worth knowing before you dig into matchups:
- Zero days rest: the technical term for a back-to-back; the team played the night before with no gap.
- Second night / second leg: the game that follows the back-to-back’s first game, the one where fatigue actually shows up statistically.
- Rest edge: the differential between one team’s schedule burden and its opponent’s, explained further below.
- Load management: a team resting a starter or top-line player during a back-to-back to protect against injury or poor performance.
- Travel back-to-back: a subtype where the second game requires relocation, not just a same-city turnaround.
Understanding these terms matters because sportsbooks price games differently depending on which version of a back-to-back is in play, and the gap between a home-to-home second leg and a cross-country travel back-to-back can be the difference between a live bet and a trap.
Which teams play the most back-to-backs, and why it matters
Not every team absorbs the same rest burden. Schedule-release analysis shows some clubs face far more zero-rest nights than others purely because of where they sit on the map and how the league builds travel routes around them. Teams based in the Pacific and Central time zones with fewer natural travel partners nearby often draw more condensed stretches, while teams clustered in the Northeast and mid-Atlantic can space games out more easily thanks to shorter hops between arenas.
The more useful number for bettors isn’t how many back-to-backs a team plays. It’s the net rest edge, the gap between how often a team faces a rested opponent on a tired night versus how often it is the tired team itself.
- A team that rarely plays back-to-backs itself but frequently draws opponents who are on the second leg holds a positive rest edge, and that shows up in win totals over a season.
- A team stuck with a heavy back-to-back load and a travel-dense schedule holds a negative rest edge, which tends to erode standings points independent of raw roster talent.
- Schedule breakdowns by team show this tilt is often about rest distribution, not opponent quality, meaning two teams with similar talent can have wildly different expected outcomes based purely on scheduling luck.
Divisional geography plays a direct role here too. Teams in divisions with tight travel radii (short flights, similar time zones) absorb fewer punishing stretches than teams whose division rivals are scattered across multiple time zones. When you’re scanning a schedule for value, check not just whether a team is on a back-to-back, but whether its opponent has been feasting on tired teams all season. That context changes how much weight the situation deserves.
How back-to-backs move the numbers: points, scoring, and goalies
Statistic to know: Multi-season research aggregated by Rg finds that points percentage on zero days of rest sits meaningfully below points percentage in games following a normal rest cycle, and only a small handful of teams manage to outperform expectations in back-to-back spots. That gap is the foundation for almost every betting angle in this article.
The mechanism isn’t mysterious. Peer-reviewed sports-science research on recovery windows and repeated high-intensity efforts documents measurable drops in output when athletes don’t get adequate recovery between exertions. Hockey is built on repeated shifts of maximal effort, so a compressed recovery window shows up in puck battles lost, second and third efforts skipped, and defensive-zone coverage that arrives a half-second late.
That translates directly into betting markets. ESPN’s analysis of saved odds across recent seasons found road favorites won at roughly 62.8% in typical spots, but that rate climbed to about 72.2% when the home team was playing the second night of a back-to-back. That’s not a marginal shift. It’s close to a ten-point swing in win rate tied to a single scheduling variable.
Totals move too. Games involving a second-night team hit the over at a higher rate than the league baseline, largely because tired teams defend worse late in games and give up more high-danger chances in the third period than they generate. Margin of victory also tends to spike in these spots. Road favorites don’t just win more, they win by more, which matters if you’re shopping puck lines or alternate spreads instead of straight moneylines.
A few practical patterns worth tracking:
- Backup goalies start more often on the second leg of a back-to-back, and team-level notes on goalie handling show some clubs almost never play their starter in that spot.
- A confirmed backup start changes save percentage expectations and shifts player-prop markets, particularly shots-against and goals-against props.
- Road favorites facing a second-night home team see inflated win probability, and that inflation compounds when the home goalie is also a backup.
Bettors who track only the win/loss record on back-to-backs are leaving information on the table. The goalie assignment and the shot-volume trend both move independently of the final score, and both are visible before puck drop if you’re watching lineup news.
Betting angles: turning rest data into wagers
The clearest edge in NHL back-to-back betting is fading the second-night home underdog. When a home team is on zero rest and facing a road favorite, the market often underprices how much that fatigue actually costs.
That doesn’t mean you blindly bet every road favorite against a tired home team. Line value matters. A road favorite already priced at heavy juice offers less room for profit even if it wins more often, so the sweet spot tends to be moderate favorites (roughly minus-130 to minus-170) where the market hasn’t fully priced in the rest disadvantage.
Pro Tip: Check whether the home team is also on the road-heavy end of a travel back-to-back, arriving after a game in a different time zone the night before. That version of fatigue tends to move lines more than a simple same-city back-to-back, and the market is slower to adjust for it.
Totals present a second angle. Overs hit more often in second-night spots because tired defenses collapse late, not because tired offenses suddenly get better. That distinction matters for how you build the bet:
- Check the penalty kill. A weak penalty-kill unit facing a rested power play compounds the fatigue effect and pushes totals higher.
- Check shot-volume trends. Teams that already generate high shot totals tend to pile up even more shots against a tired opponent, which supports both the over and shots-based player props.
- Check the goalie matchup. A backup goalie on the tired team facing a hot starter on the rested team is the single strongest over signal in this entire framework.
Player props deserve their own look. Goalie saves props tend to run higher for the rested team’s starter, since a tired opponent generates more rebound chances and extended shifts in the defensive zone. Shots-on-goal props for top-six forwards on the rested team also trend upward, since fresher legs support more zone time and more shot attempts. None of this works if you’re guessing at the goalie. Confirm the starting goalie through team beat reporters or live schedule tools before locking in a prop, because a surprise starter swap can flip the entire premise of the bet.
A short situational checklist before you bet any back-to-back spot:
- Is the tired team also dealing with a travel back-to-back, not just a same-city turnaround?
- Has the tired team’s starting goalie played on both nights of similar stretches this season, or does the team rotate reliably?
- Is a key top-line player dealing with a minor injury that a coach might manage around fatigue?
- Does the rested opponent have a track record of exploiting tired teams, or is this an isolated schedule quirk?
Stack two or three of these red flags together and the edge compounds. A single back-to-back flag is useful. A back-to-back combined with a confirmed backup goalie and a bad travel setup is a much stronger signal than either factor alone.
How to build a quick back-to-back score for any matchup
You don’t need a full statistical model to act on rest data. A compact scoring rubric lets you rank matchups fast, before lines move, using inputs you can check in a few minutes.
Start with the essential inputs:
- Zero-rest flag — is the team playing its second game in as many nights?
- Location — home or away on the second leg (home underdogs on zero rest are the priority target)
- Travel distance — same city, short hop, or cross-country/time-zone shift
- Goalie status — confirmed starter or backup, and how that goalie has performed recently
- Recent form — points over the last two weeks, independent of the back-to-back itself
- Days off before the stretch — a team entering a back-to-back off extended rest absorbs the hit better than one already running on fumes
- Roster usage — has the coach been managing minutes or resting regulars heading into the stretch?
A workable weighting approach treats zero-rest status as the dominant factor, since it’s the variable with the clearest statistical backing, while treating goalie status, travel burden, and recent form as meaningful secondary inputs, and lineup churn as a smaller adjustment on top. The exact percentages matter less than the ranking they produce: zero-rest and goalie status should always outweigh recent form and roster tinkering, because those two factors have the strongest tie to actual outcomes.
Once you’ve scored a matchup, use the number as a screening tool rather than an automatic bet trigger. A high score against a road favorite that’s already juiced to minus-200 or worse isn’t a value bet, it’s just confirmation of what the market already priced in. The score is most useful for finding mispriced spots, games where your rest-adjusted read is more extreme than what the line suggests. That’s where flagging a matchup with a tool like StatMuse’s back-to-back schedule filters earns its keep, letting you scan the full slate for zero-rest teams in seconds rather than checking one team at a time.
What the history books say about back-to-back trends
Look across several seasons and the pattern holds steady. Zero-rest games underperform rested games in points percentage year after year, even as the league has trimmed the total number of back-to-backs scheduled per team. That consistency is what makes the effect settable rather than a one-season fluke.
What’s shifted over time is volume, not magnitude. As the league has spread the calendar out and reduced congested stretches around the holidays, the number of back-to-back nights per team has declined, but the size of the performance gap on the nights that remain hasn’t shrunk much. Fewer opportunities, similar edge per opportunity.
There’s also a seasonal rhythm worth knowing. Back-to-backs cluster more heavily in the first two months of the season and again in the stretch run before the playoffs, when teams are compressing makeup games and travel around the calendar’s tail end. Early-season back-to-backs tend to hit conditioning-related fatigue harder, since players haven’t built up full-season stamina yet. Late-season ones interact with injury accumulation, a factor that compounds the standard rest disadvantage.
One more historical wrinkle: the gap between contending teams and rebuilding teams on back-to-backs has narrowed somewhat in recent eras, as analytics departments across the league have gotten more disciplined about load management and goalie rotation. Teams that ignored the data a decade ago are now actively managing around it, which means the sharpest bettors are the ones tracking how a specific team’s front office handles rest, not just whether a back-to-back appears on the schedule.
Travel distance and time zones make fatigue worse
Not all back-to-backs punish a team equally, and travel is the biggest multiplier. A team playing the same city twice in a row deals with pure physical fatigue. A team flying cross-country between games, especially with a time-zone shift, adds circadian disruption on top of that fatigue, and the combination tends to produce the worst statistical outcomes of any back-to-back subtype.
West-to-east travel tends to be the toughest version, since teams lose sleep hours flying into an earlier time zone and often land in the middle of the night before an afternoon or evening game the next day. East-to-west trips are somewhat easier to absorb because players gain time rather than lose it, even though the travel distance itself might be identical.
Divisional geography again plays a role here. Teams whose divisions span multiple time zones (a increasingly common reality with modern realignment and interconference scheduling) rack up more disruptive travel back-to-backs than teams whose rivals sit in a tight geographic cluster. That’s part of why the rest-edge concept discussed earlier isn’t just about how often a team plays back-to-backs, but about which kind of back-to-back it’s stuck with.
For bettors, the practical takeaway is simple: treat a same-city back-to-back and a cross-country, cross-time-zone back-to-back as two different situations entirely, not the same schedule flag. The market sometimes fails to distinguish between them, and that gap is exactly where value hides.
Star players and depth lines don’t feel fatigue the same way
Fatigue from a back-to-back doesn’t distribute evenly across a roster. Top-line forwards and top-pair defensemen, the players logging the heaviest minutes, tend to show the sharpest drop-offs in shift quality on the second night, since they have the least recovery buffer built into their usage to begin with.
Depth players, ironically, sometimes see a usage bump on back-to-backs as coaches lean on their legs to spare the top lines extra ice time. That shift in deployment matters for prop bettors specifically: a third-line center who normally plays 11 minutes a night might see 14 or 15 on a back-to-back, which can push shot-based or ice-time-based props above their normal range even though that player individually isn’t as fatigued as the stars around him.
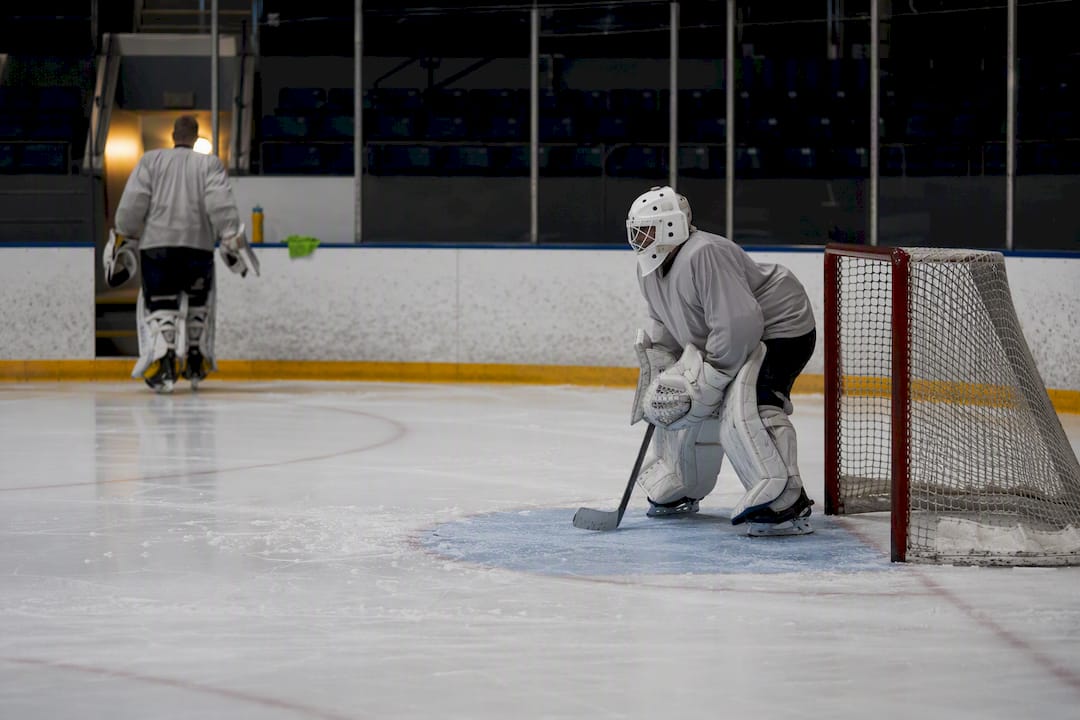
Goaltenders face a different version of this dynamic entirely. Starting goalies who play both nights of a back-to-back deal with a documented decline in save percentage on the second leg, which is part of why so many teams now default to the backup in that spot rather than risking the starter’s workload. That goalie rotation decision, discussed earlier as a betting signal, is really a direct response to this fatigue asymmetry between roster positions.
Line combinations matter too. Coaches sometimes shorten their bench on back-to-backs, trusting fewer players for more minutes rather than spreading ice time evenly. That tightening can concentrate scoring chances (and prop value) into a smaller group of skaters, which is worth checking against projected lineups before betting individual player props on a second-night game.
How teams actively manage back-to-back fatigue
Coaching staffs don’t just accept back-to-back fatigue as inevitable. Most NHL teams now build explicit plans around these stretches, and understanding those plans helps explain why some teams outperform their rest disadvantage while others don’t.
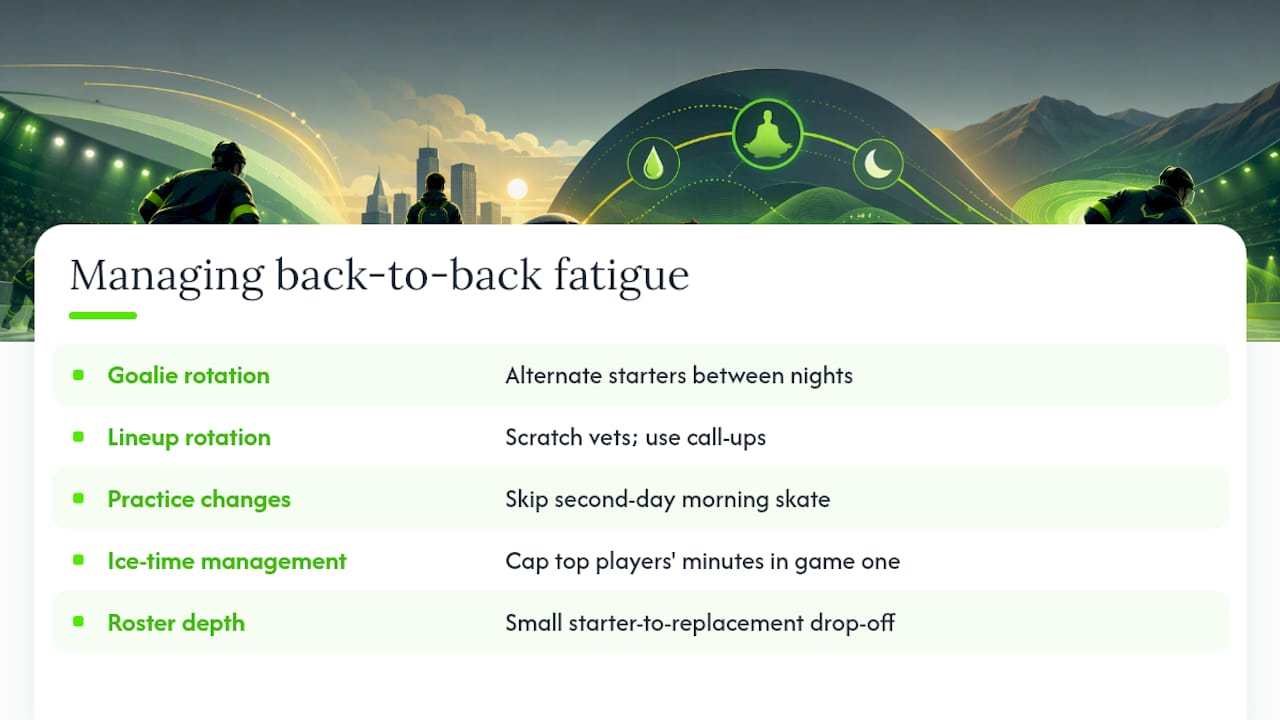
The most common tool is goalie rotation, already covered above, but lineup rotation for skaters follows similar logic. Teams will occasionally scratch a veteran defenseman or fourth-line forward on the second night of a back-to-back purely to manage cumulative wear, inserting a healthy scratch or call-up in their place. That’s a subtle roster shift that doesn’t always make headlines but can affect matchup quality on the ice.
Practice schedules shift too. Teams facing a back-to-back frequently skip morning skate entirely on the second day, opting for extra sleep and a lighter pregame routine instead of the standard on-ice preparation. That’s become close to universal practice across the league in recent years, a direct response to sports-science research on recovery windows.
Some organizations go further with staggered ice-time plans, deliberately capping their top players’ minutes in the first game of a back-to-back if the score allows it, banking energy for the second night rather than riding a hot line into exhaustion. This only works when the first game isn’t close, so it’s more of a soft strategy than something bettors can count on every time.
The teams that manage these stretches best tend to share a common trait: a deep enough roster that the drop-off from starter to replacement, whether in net or in the lineup, is small. That depth factor is part of why “which teams are good on back-to-backs” isn’t really about willpower or coaching genius. It’s about roster construction and how much a team’s performance depends on a handful of players who can’t be rested without hurting the result.
Injury risk climbs on the second night
Back-to-backs don’t just affect scoreboards. They carry a real injury cost that both teams and bettors should factor in. Compressed recovery windows leave less time for minor knocks, tweaks, and soreness to resolve before the next physical test, and the peer-reviewed literature on fatigue and repeated high-intensity effort supports the mechanism: tired muscles and slower reaction times increase the odds of a collision going wrong or a joint absorbing awkward stress.
This is part of the reason load management decisions, resting a banged-up veteran on the second leg rather than risking a bigger issue, have become standard practice across the league rather than an exception. A player already dealing with a minor lower-body injury is a much higher risk to sit or leave early during a back-to-back than during a normally spaced game, and coaching staffs know it.
For bettors, this means injury news deserves extra weight specifically around back-to-back games. A questionable tag on a key player carries more real risk of an early exit or a full scratch in a zero-rest spot than it would in an isolated game with a full week to recover. Checking injury reports isn’t just a pregame formality here, it’s a direct input into how confident you should be in a lineup actually finishing the way it started.
Combining back-to-backs with other situational factors
The strongest betting angles rarely come from a single variable. A back-to-back flag by itself is useful, but stacking it with home/away splits and opponent strength turns a decent signal into a genuinely sharp one.
But that number represents an average across many matchups of varying quality. A road favorite that’s already strong on the road, and facing a home team that’s already struggling regardless of rest, offers a stronger version of the same trend than a mediocre road team catching a break against a tired but talented home club.
Opponent strength cuts the other way too. A dominant home team on a back-to-back against a weak road opponent might still be worth backing despite the rest disadvantage, since the talent gap can outweigh a single night of fatigue. The rest-edge framework isn’t a replacement for evaluating team quality, it’s a filter layered on top of it.
Divisional matchups add another wrinkle. Teams that know their rivals well sometimes game-plan differently against a tired divisional opponent than against an unfamiliar out-of-conference team, since familiarity can amplify the advantage of a fresher roster attacking known weaknesses. Combine a back-to-back flag with a divisional road favorite and a documented backup goalie start, and you’ve stacked three independent signals pointing the same direction, which is exactly the kind of spot worth prioritizing over a single-factor bet.
Manny’s Variety perspective: how we use rest-edge signals in practice
Rest-edge data doesn’t replace a full model, but it’s one of the highest-signal inputs we feed into NHL projections because the effect is consistent across seasons rather than a one-off trend. We weight zero-rest status alongside goalie confirmation and travel burden, then adjust live as lineup news breaks. That approach sits behind Manny’s Variety’s tracked NHL results, part of a platform-wide record of over 1,600 graded picks and a 63.5% win rate across sports.
— Manuel
Get rest-adjusted NHL picks without building the model yourself
Manny’s Variety turns everything covered above, rest-edge scoring, goalie confirmation, travel burden, into daily NHL picks instead of leaving you to build a spreadsheet from scratch every game night. The platform’s sport-specific AI engine runs thousands of simulations per matchup, folding in back-to-back status alongside recent form, injury news, and market movement, then publishes the resulting picks with a permanent, publicly graded track record behind them.

That transparency matters in a market full of unverifiable “expert” callouts. For NHL bettors specifically, that means access to daily picks that already account for second-night fatigue, backup goalie situations, and travel-heavy stretches before you ever open a sportsbook app.
If you want to see the model working in real time on tonight’s slate, check out live in-game picks for rest-aware adjustments as lineups get confirmed. Curious how the underlying methodology actually works before subscribing? The how-it-works breakdown walks through the simulation approach and current subscription options, including a free trial to test it against your own back-to-back reads.
Sources
This analysis draws on four categories of sources: ESPN’s saved odds and outcome data across recent seasons, schedule-query tools like StatMuse for live back-to-back identification, multi-season points-percentage research from RG.org, and peer-reviewed sports-science literature on recovery windows.
A few limitations are worth flagging honestly:
- NHL Betting tips: How back-to-backs can help bettors pick - ESPN
- Schedule Of NHL Teams Playing Back To Back Games | StatMuse
- How NHL Schedule Factors Affect Team Results | Research, News
- The 2026-27 NHL Schedule, by Team: Who the 84-Game Grid Favors | Hockey Alchemy
- PubMed - relevant sports science article on fatigue and recovery