

How Many Bets Make a Reliable Sample Size in Sports Betting?
Fewer than 500 bets tells you almost nothing about whether you have a real edge. Between 500 and 1,500 bets, results start to become suggestive.
The exact figure you need depends on the edge you’re testing, and you can calculate it yourself using the sample-size formula covered below. As one concrete anchor: detecting a 2% edge (52% versus a 50% break-even line) at standard statistical thresholds takes nearly 4,000 bets.
- Under 500 bets: essentially uninformative
- 500 to 1,500 bets: suggestive, not conclusive
- 1,500 to 5,000 bets: workable for edges of 3% to 5%
- 5,000 to 10,000+ bets: needed for edges under 2%
Key Takeaways
A reliable read on any betting strategy depends on matching your sample size to the edge you’re claiming, since smaller edges demand exponentially larger samples before the noise clears.
| Point | Details |
|---|---|
| Under 500 bets tells you little | Treat small samples as anecdotal, not evidence of a real edge. |
| Bigger edges confirm faster | A win rate needs roughly 1,200 to 1,400 bets versus thousands for others. |
| Variance shrinks slowly | Uncertainty falls with the square root of bet count, so long losing runs happen even with a real edge. |
| Track CLV, not just win rate | Closing-line value has lower variance and signals process quality sooner than raw results. |
| Verified archives cut through the guesswork | Mannysvariety publishes a graded, permanent record allowing bettors to inspect the sample directly. |
Where to Check the Math and Track Your Own Numbers
- The sample-size chapter covers the formula and a full table of required bets by edge size.
- The Compare n’ Bet guide walks through worked examples at common win rates.
- The AgentBets guide explains power, alpha, and Bayesian alternatives for small samples.
- A Poisson goal model breakdown shows how per-game probabilities get built before they ever reach a sample-size calculation.
Table of Contents
- Why Sample Size Sports Betting Analysis Gets Misread
- The Formula Behind Required Sample Size
- What the Numbers Look Like at Common Win Rates
- A Protocol for Testing Your Own Betting Strategy
- How Long Confirmation Takes and How to Survive the Wait
- What the Math Actually Means for How You Bet
- Frequently Asked Questions
- Sources
Why Sample Size Sports Betting Analysis Gets Misread
Variance doesn’t shrink in a straight line as your bet count grows. It scales with the square root of the number of bets, so cutting your uncertainty in half means placing four times as many wagers, not twice as many. That’s the mechanical reason a 20 unit heater over 50 bets means almost nothing, and why a 20 unit downswing over the same stretch doesn’t prove your model is broken.
A real edge and pure randomness both produce hot streaks and cold streaks. A bettor running a legitimate 54% strategy will still lose 8 or 10 bets in a row somewhere along the way, purely from variance. Confusing that streak with a sign the strategy stopped working is one of the most common analytical errors in the hobby.
Bet type changes the math too. Straight moneyline and spread bets carry lower per-bet variance than parlays or player props, where payouts swing wider and outcomes correlate. Higher-variance bet types need proportionally larger samples to say anything with confidence.
- Single-game sides and totals: moderate variance, moderate sample needs
- Player props: higher variance, larger samples required
- Parlays: highest variance, samples in the tens of thousands before conclusions hold up
Pro Tip: Track closing-line value (CLV) alongside win/loss results. CLV has lower variance than raw outcomes, so it can flag a strong process well before your win rate sample is large enough to confirm it on its own.
The Formula Behind Required Sample Size
The standard one-sample proportion test gives you the formula bettors actually need:
n = (z_α + z_β)² × p(1-p) / (p − p₀)²
Here, p₀ is your break-even win rate (about 52.38% at standard -110 odds), p is the win rate you’re claiming, and (p − p₀) is your effect size. z_α corresponds to your significance level (1.96 for a two-tailed test at α=0.05), and z_β corresponds to your statistical power (0.84 for 80% power).
Plugging in different assumptions moves the required n dramatically. Widen your claimed edge, and the required sample drops fast, since edge size and sample requirement follow an inverse relationship: halve the edge, and you roughly quadruple the bets needed.
| Assumption | Effect on required n |
|---|---|
| Alpha 0.05 | Increases required n |
| Power 80% | Increases required n |
| Edge doubles | Required n falls roughly fourfold |
| Sample under ~50 bets | Normal approximation breaks down |
At very small samples, the normal approximation the formula relies on stops holding up. Below roughly 50 bets, exact binomial tests or a Bayesian posterior give more honest results, since a Bayesian approach also lets you fold in a reasonable prior about how big real sports betting edges tend to be.
What the Numbers Look Like at Common Win Rates
It’s the difference between needing a career’s worth of bets and needing a busy season.
ROI tells a similar story.
- At 2 bets per day, 2,485 bets takes about 3.4 years
- At 5 bets per day, the same sample takes about 16 months
- At 10 bets per day, you clear it in roughly 8 months
Volume compresses the calendar, but it doesn’t change the math. A bettor firing off 10 low-conviction bets daily just to hit a number faster usually dilutes the edge they were trying to prove in the first place.
A Protocol for Testing Your Own Betting Strategy
Run your test like a controlled experiment, not a running tally you eyeball after every losing weekend.
- Set your hypothesis first. Decide your assumed edge, target sample size, alpha, and power before you place a single bet under the new strategy.
- Log everything. Stake, opening line, closing line, CLV, market, bet type, and timestamp for every wager.
- Choose the right test for your sample. Use exact binomial methods under roughly 50 bets, a z-test or Wilson interval once you’re past that, and a Bayesian posterior if you want a running probability-of-edge estimate.
- Control for multiple testing. If you’re evaluating several strategies at once, apply a Bonferroni or false-discovery-rate correction rather than reporting whichever one happened to look best.
- Resist post-hoc slicing. Don’t cherry-pick a subset of games after the fact to make a mediocre result look strong.
Pro Tip: A tool like a dedicated bet-tracking platform automates the recordkeeping in step 2, which removes the temptation to selectively remember your wins.
How Long Confirmation Takes and How to Survive the Wait
Translating required bets into a calendar is where most bettors lose patience.
- 2,485 bets at 2/day ≈ 3.4 years
- 2,485 bets at 5/day ≈ 16 months
- 2,485 bets at 10/day ≈ 8 months
Because variance shrinks only as the square root of your sample, a long losing stretch in month four doesn’t mean the strategy failed. It means you’re still inside the noise. Sizing up to “catch up” during a rough patch is the single fastest way to turn a legitimately profitable strategy into a blown bankroll before it ever gets the chance to prove itself.
Why Verified Track Records Matter More Than Confidence
Any picks service can claim an edge. Few can show the underlying sample. Permanent, ungraded archives matter because they let you check win rate against volume rather than a cherry-picked hot streak. Before trusting any service, ask how many picks they’ve tracked, whether losing picks stay visible, and how their methodology is documented.

What the Math Actually Means for How You Bet
Most betting advice treats sample size as an afterthought, something you check after the fact if results disappoint. That’s backward. The math should shape your expectations before you place bet one, not serve as an excuse afterward.
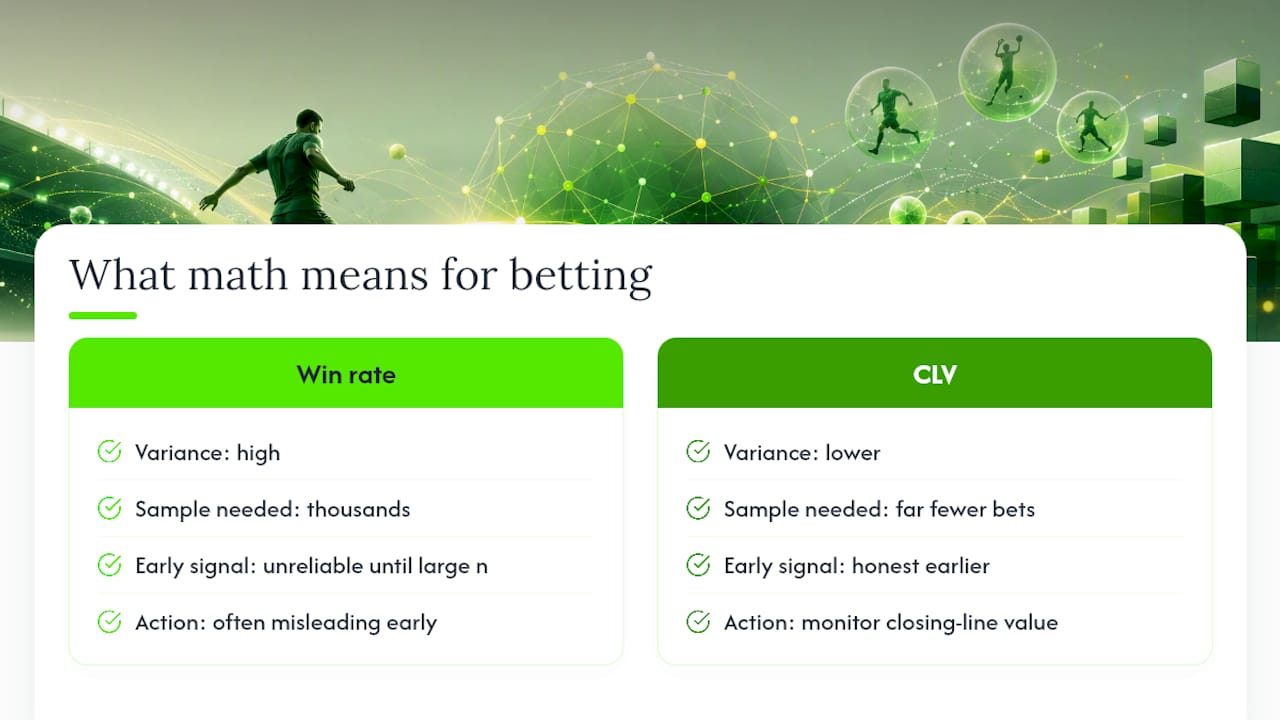
The biggest gap between conventional wisdom and reality is this: bettors chase win rate when they should be watching CLV. Win rate needs thousands of bets to mean anything. CLV, because it has lower variance, starts telling you something about process quality much sooner. If your closing-line value is consistently positive, that’s often a more honest early signal than a streaky record over 200 bets.
The other thing recreational bettors underestimate is how brutal the inverse-square relationship really is. They’re looking at a test that’s roughly four times longer. Most people quit or change strategies long before their sample reaches a size that could tell them anything definitive. If you take one thing from all of this, take the discipline to calculate your required n before you start, and the patience to let the sample get there.
Another Path: Faster Feedback Through Verified Daily Picks
Running your own multi-year sample isn’t the only way forward. Mannysvariety offers a shorter feedback loop for bettors who want data-driven signals without waiting years to accumulate their own sample.

The platform runs sport-specific AI engines across MLB, NBA, NFL, and other major leagues, generating daily picks backed by real-time analytics and thousands of simulations per matchup. Bettors who want higher-frequency signals can also check the live in-game picks for faster-turnaround opportunities.
Even verified picks still deserve the same discipline covered above: flat-unit staking, proper bankroll sizing, and realistic expectations about variance. Review the full methodology to see how the archive is built and decide whether it fits your bankroll plan.
Frequently Asked Questions
How many bets do I need to know if I have an edge? It depends on the size of the edge.
Is 100 bets enough to judge a betting strategy? No. A hundred bets falls well inside the range where variance dominates the result, so both winning and losing streaks are common regardless of whether a real edge exists.
What is regression to the mean in sports betting? It’s the tendency for extreme early results, unusually hot or cold stretches, to move back toward a bettor’s true long-run win rate as the sample grows larger.
Should I use win rate or closing-line value to judge my strategy? CLV is a faster signal because it carries lower variance than win/loss outcomes, making it useful for early process checks while your win-rate sample is still building.
How does bet type affect the sample size I need? Higher-variance bet types like parlays and player props need larger samples than straight sides or totals, since wider payout swings inflate the uncertainty around any given win rate.
Sources
- Chapter 8: Hypothesis Testing and Statistical Significance | Sports Betting
- Sample Size and Statistical Significance in Betting - Compare n’ Bet
- Statistical significance in sports betting | AgentBets
- Variance and bankroll management for player props | Wizard of Odds