

Starting Pitcher Models: Use Distributions and Public Track Records for Fantasy
A starting pitcher model predicts a pitcher’s next outing by estimating strikeouts, walks, innings or outs, and earned runs, then packages those components into a fantasy point range or prop probability. The best versions expose uncertainty instead of hiding it behind one clean number, and they flag when a probable starter isn’t yet confirmed — a technique explained in detail in predictive analytics in fantasy sports that helps form an edge. Everything below explains the inputs, the modeling choices, and the checklist to run before you lock a lineup.
TL;DR:
- The model predicts a pitcher’s next start by forecasting strikeouts, walks, innings, and earned runs separately, rather than providing a single aggregate number.
- Recent form, workload, opponent quality, park conditions, and confirmed starter status significantly influence the forecast, with probabilities offering insight into outcome ranges.
- Distribution-based models provide a safety range and probability for outcomes, making them more useful for DFS decisions than single-point projections.
- Validation of models requires transparent tracking, walk-forward testing, and error metrics to ensure reliability over time.
- Trust the model more for experienced pitchers with confirmed roles and verify starting lineups and conditions close to game time for rookies and uncertain starters.
Table of Contents
- What Does a Starting Pitcher Model Predict, and How Does It Score?
- Which Pregame Inputs Actually Move a Next-Start Forecast?
- Why Distributions Beat a Single Projected Number
- Common Pitfalls in Next-Start Pitching Models
- How Should a Model’s Track Record Be Validated?
- Turning Projections Into Lineup and Bid Decisions
- When Should You Trust the Model, and When Should You Trust Your Gut?
- Get AI-Backed Pitcher Projections With a Public Track Record
- Sources
- FAQ
What Does a Starting Pitcher Model Predict, and How Does It Score?
A starting pitcher model breaks a next outing into separate component forecasts rather than guessing one aggregate score. Each component gets its own estimate because strikeouts, walks, innings, and earned runs behave differently start to start, and lumping them together hides where the real risk sits.
The standard component set looks like this:
- Strikeouts (K): driven by swing-and-miss stuff and opponent chase rates.
- Walks (BB): tied to command and, often, ballpark or umpire tendencies.
- Innings/outs: shaped by pitch efficiency, bullpen usage plans, and score state.
- Earned runs (ER): the most volatile output, often modeled through a run-distribution rather than a single number.
- Optional derived metrics: FIP or xFIP estimates that sanity-check the ER projection against quality of contact allowed.
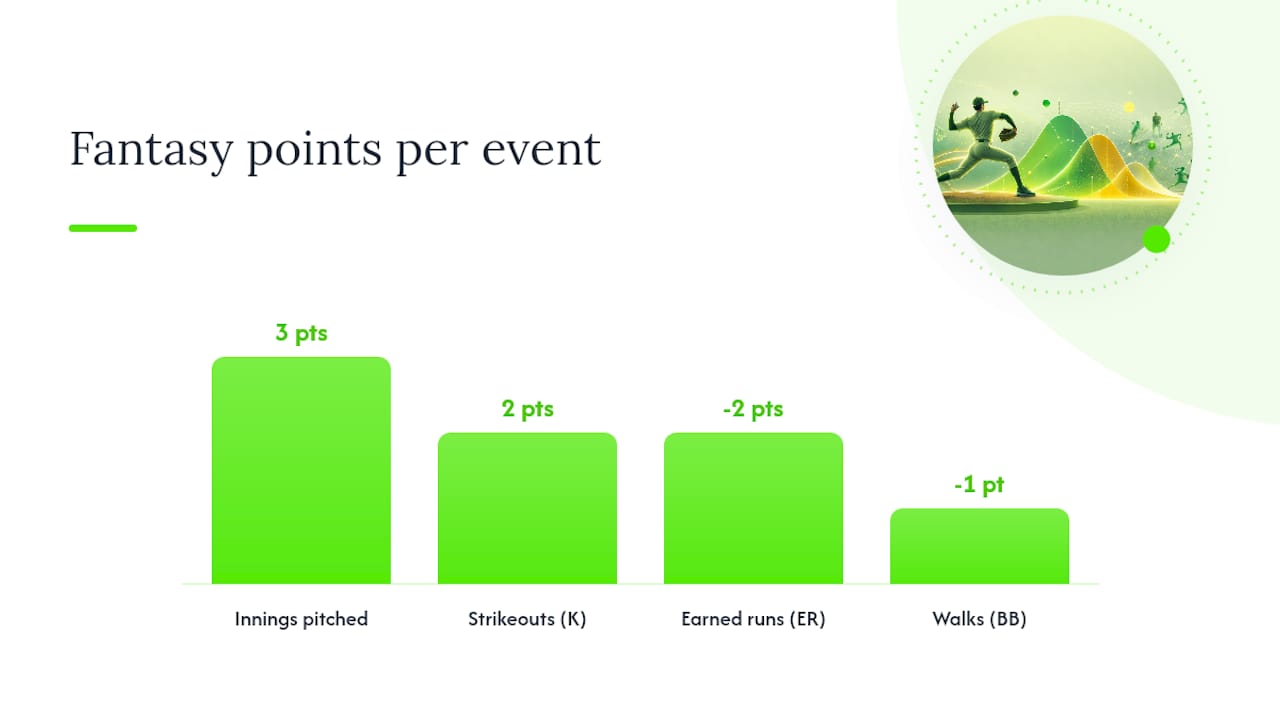
Statistic Callout: A simple points formula might weight strikeouts at 2 points each, innings pitched at 3 points, walks at negative 1, and earned runs at negative 2. Run typical projections through that formula to get a fantasy point estimate, before adjusting for a win or quality start bonus.
Games-started credit complicates this math. A league that awards points for a start, regardless of length, rewards a pitcher differently than one that scores purely on innings and outcomes. Check your league’s rules before trusting any single point total.
Which Pregame Inputs Actually Move a Next-Start Forecast?
Not every data point deserves equal weight. Recent form, workload and rest, opponent lineup quality, ballpark, weather, and the official probable-pitcher listing all belong in a serious model, but they don’t move the needle equally.
Rank them by practical impact:
- Recent form and workload: pitch counts and days of rest over the last two to three starts.
- Opponent lineup quality and handedness split: who’s actually standing in the box, not season-long team averages.
- Park and weather: wind direction and altitude swing both strikeout and home run rates.
- Official probable-starter status: confirmed versus listed, since MLB’s probable-pitcher pages are provisional and change on short notice.
On the metrics side, ERA lags reality. Statcast previews surface expected weighted on-base average, expected batting average, exit velocity, hard-hit rate, and strikeout and walk rates, all of which describe underlying skill better than a run total that bounces around with defense and sequencing.
Pro Tip: Treat “probable starter” as a hypothesis, not a fact, until it’s confirmed. A model that can’t distinguish a locked-in starter from a listed one will feed you a confident number for a pitcher who never takes the mound.
Why Distributions Beat a Single Projected Number
A point estimate tells you what a model thinks will happen on average. It says nothing about how often reality lands nowhere close. That gap matters more in pitching than almost any other fantasy position, because a single bad inning can wreck an otherwise strong outing.
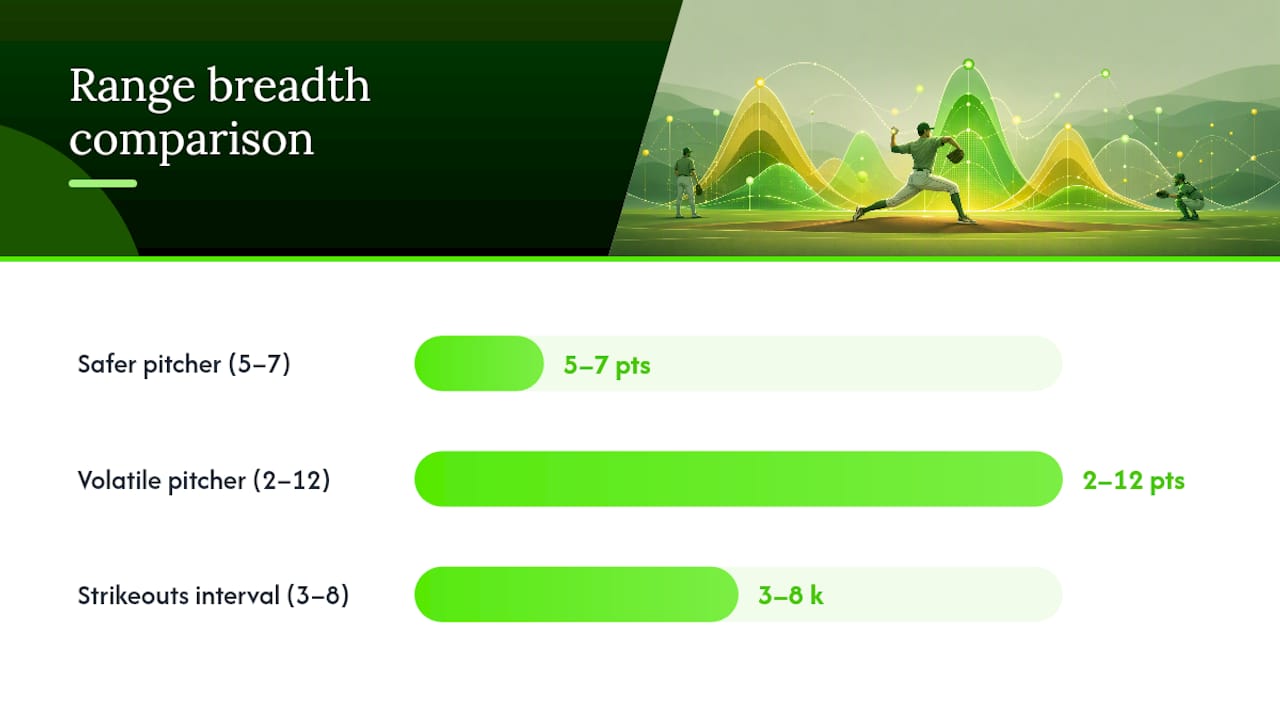
Distributional models close that gap. Instead of “5.5 strikeouts,” a well-built system outputs a range, say 3 to 8 strikeouts with 80% confidence, and a probability attached to each outcome. Bayesian hierarchical approaches push this further by borrowing statistical strength across the whole population of pitchers. A rookie making his fourth career start doesn’t get judged purely on those four outings; his projection gets pulled toward a reasonable league baseline until his own sample grows large enough to override it.
That matters for DFS in a very specific way:
- A pitcher projected at 6.0 fantasy points with a tight range (5 to 7) is a safer cash-game play.
- A pitcher projected at 5.5 points but with a wide range (2 to 12) might be the better tournament dart throw, because the upside tail is where large-field contests get won.
A calibrated credible interval doesn’t just hedge a forecast. It tells you which pitcher is a coin flip and which one is close to a lock, information a single number erases completely.
Common Pitfalls in Next-Start Pitching Models
Even solid inputs and good math fall apart if the model ignores structural quirks in how teams deploy pitchers today. A few traps show up constantly.
- Confusing “credited start” with real workload. An opener can record a games-started credit while throwing one inning and striking out nobody. Model expected workload directly, not the games-started label.
- Ignoring removal probability. Modern managers pull starters earlier through the lineup a third time around. Model pitch-count and times-through-order effects instead of assuming a flat innings target.
- Data leakage from postgame information. Any model that peeks at final box scores while grading itself will look artificially sharp. Freeze inputs before lock and validate on a walk-forward basis only.
- Stale probable-starter data. Confirm the starter, the lineup, the weather, and any late scratches right before lock, not the night before.
Pro Tip: Run your pre-lock checklist twice on marquee slates. Late scratches cluster around getaway days and doubleheaders, exactly when the biggest DFS contests fill up.
How Should a Model’s Track Record Be Validated?
Trusting a projection means trusting the process behind it, and that requires proof the model was graded honestly. Archiving the exact model version, timestamp, and input snapshot for every forecast is the foundation. Without that snapshot, there’s no way to prove a forecast wasn’t quietly adjusted after the fact.
From there, three practices separate a trustworthy system from a marketing claim:
- Walk-forward validation: test the model only on data it hasn’t seen, in the order games actually happened.
- Error and coverage metrics: report mean absolute error for runs, outs, and strikeouts, plus how often the actual outcome falls inside the stated credible interval.
- A public grading ledger: compare frozen forecasts against final box scores, openly, so patterns of over or underconfidence become visible over time.
A model with a published, auditable track record earns more trust than one that simply claims accuracy without showing its grading history.
Turning Projections Into Lineup and Bid Decisions
A projection only matters once it changes what you actually do. The translation from model output to roster move follows a few consistent heuristics.
- Use the lower bound for floor-sensitive spots. Cash games and season-long lineups where a bust tanks your week call for the conservative end of the range, not the mean.
- Use the upper tail for tournament upside. Large-field DFS rewards the pitcher whose ceiling includes an 11-strikeout outing, even if his median projection looks ordinary.
- Weigh FAAB bids against projected point delta. A waiver-wire arm worth 3 extra points per start over your current option is worth a real bid, not a token one.
- Recheck confirmation before you finalize anything. A great projection for an unconfirmed starter is worthless the moment a scratch hits the wire.
Statistic Callout: If a streaming option projects 2 points higher per start than your current fifth starter across a projected five remaining starts, that’s a 10-point season swing, often worth a meaningful chunk of FAAB budget on its own.
When Should You Trust the Model, and When Should You Trust Your Gut?
Models earn trust fastest on pitchers with a real track record and a confirmed role. They deserve more skepticism for rookies, injury-return starts, and anyone facing a lineup with a thin sample against his specific pitch mix. An audited, versioned forecast history is the difference between a system you can lean on and one asking for blind faith. Whatever the model says, respect your bankroll: no projection, however calibrated, guarantees an outcome.
— Manuel
Get AI-Backed Pitcher Projections With a Public Track Record
Most fantasy tools hand you a number and ask you to trust it. Mannysvariety publishes the receipts instead. Its sport-specific AI engines run real-time simulations and log every pick to a permanent, publicly gradable track record, so you can check calibration yourself rather than take a marketing claim on faith.

The MLB picks page shows those projections applied to real slates, and the how-it-works breakdown walks through the predictive engine behind them. Coverage runs across MLB, NBA, NFL, NHL, PGA, MMA, and soccer, with plans built for different levels of use: Free at $0, Core at $39.99 per month, and Elite at $79.99 per month, all detailed on the pricing page. Start with the free tier, compare the projections against your own next-start decisions, and upgrade once you’ve seen the archive for yourself.
Sources
FAQ
What Is a Starting Pitcher Called?
A starting pitcher, often shortened to “SP” or “starter,” is the pitcher who begins the game for his team. The MLB glossary notes that a five-man rotation and pitch counts near 100 usually provide several days of rest between outings, which is why fantasy models treat the next scheduled start as the actionable unit.
How Do I Find the Starting Pitchers for This Week?
MLB’s official probable pitchers page lists upcoming projected starters for every team, updated as rotations firm up. Treat these listings as provisional and recheck closer to lock, since rotation moves and scratches happen right up until game time.
How Much Does a Starting Pitcher Make?
Starting pitcher salaries vary enormously by service time, arbitration status, and free-agent market value, ranging from league-minimum deals for rookies to nine-figure contracts for elite free agents. That range isn’t tied to any single published figure, since it shifts every offseason with new signings.
Who Are the Top Starting Pitchers Heading Into the Season?
Rankings shift throughout the year based on health, velocity trends, and matchup strength, so no fixed list holds up all season. A model-driven approach, checking projected components like strikeout rate and innings depth for each pitcher’s next start, gives a more current answer than any preseason ranking, and services like Mannysvariety’s MLB picks update those projections continuously rather than freezing them in March.