

Under 50, 50–300, or 300+ Bets: Which Bet Tracking Method to Use
Fewer than 50 bets a year call for a simple spreadsheet. Past 100 bets, a dedicated tracker or hybrid setup starts paying for itself in saved time and fewer entry errors. The lever that actually moves your long-term results is closing line value, not weekly win totals, so pick a method today, log every bet immediately, and build toward 100+ bets before trusting any CLV read.
TL;DR:
- Tracking more than 100 bets with a dedicated system can significantly reduce errors and save time, especially when monitoring closing line value.
- Using automated apps becomes essential once betting volume exceeds 300 bets annually or crosses multiple sportsbooks, to maintain accurate, comprehensive records.
- Recording closing odds alongside initial bets is crucial for calculating CLV, which becomes a reliable long-term indicator after around 100 to 200 bets.
- Backup and data security are vital, with exports and regular copies of your records preventing loss from accidental deletion or service shutdowns.
- Proper categorization and consistent logging habits, such as instant bet entry and honest loss recording, are key to developing actionable insights from your betting data.
Table of Contents
- Bet Tracking Methods Compared: Spreadsheet, App, Hybrid, or Custom
- What Fields Belong in Every Bet Log?
- How Do You Choose the Right Tracking Tool?
- Copy-Ready Workflows for Each Tracking Method
- What Does a Verified Tracking Record Actually Look Like?
- Automatic Import and Cross-Book Aggregation
- Which Charts Actually Reveal Your Betting Patterns?
- How Should You Categorize Bets for Deeper Analysis?
- Is Your Betting Data Actually Safe?
- What Happens if You Lose Your Tracking Data?
- Connecting Bet Tracking to Bankroll Management
- What Mistakes Quietly Ruin Bet Tracking Records?
- The Habit That Actually Fixes Your Numbers
- Try Automated Tracking Built on a Verified Record
- Where to Learn More About Responsible Tracking
- Sources
Bet Tracking Methods Compared: Spreadsheet, App, Hybrid, or Custom
Every serious bettor eventually chooses between four categories of tracking, and the right one depends less on preference and more on volume and technical comfort.
Pen and paper works for pure beginners testing whether they’ll stick with tracking at all. It costs nothing and forces slow, deliberate logging, but it can’t calculate anything, can’t be searched, and falls apart past a handful of bets per week.
Spreadsheets (Excel or Google Sheets) are the default for most recreational bettors under a few hundred bets a year. You control every column, every formula, and every chart. The tradeoff is manual entry: you type in closing odds yourself, and one skipped row can quietly corrupt your CLV calculations. Spreadsheets suffice for most bettors under a few hundred bets per year, with dedicated trackers only pulling ahead once volume and cross-book activity grow.
Dedicated apps like OddsJam, Pikkit, Betstamp, JuiceReel, and SlipSync automate the tedious parts. They pull closing lines automatically, calculate ROI and CLV in real time, and often aggregate bets placed across multiple sportsbooks into one dashboard. Most run $10 to $15 a month, a cost that pays for itself once manual entry starts eating more than an hour a week.
Hybrid and custom automation suit bettors who want an app’s speed but a spreadsheet’s flexibility for deeper slicing, or developers comfortable building their own API pipeline.
- Under 50 bets/year: pen and paper or a basic sheet
- 50 to 300 bets/year: spreadsheet, upgrading if entry time exceeds an hour weekly
- 300+ bets/year or multiple sportsbooks: dedicated app or hybrid
- Building custom strategies or models: custom automation
A recent practitioner comparison frames the spreadsheet versus app debate the same way: spreadsheets win on control and cost, apps win on time saved and error reduction as volume climbs.
What Fields Belong in Every Bet Log?
A tracking method is only as good as the schema behind it. Skip a column and you lose the ability to answer the one question that matters: are you actually beating the market?
Minimum required fields:
- Date and time placed
- Sport and league
- Market type (spread, moneyline, total, prop)
- Selection and odds at placement
- Stake (in units, not just dollars)
- Sportsbook used
- Result and profit/loss
A practical bet log needs closing odds recorded alongside placement odds, because that gap is what makes closing line value calculable at all. Closing line value, or CLV, compares the odds you got against the market’s final number before the game started. If you bet a team at plus 150 and it closes at plus 130, you beat the closing line, a signal that you’re finding value before the market corrects.
Advanced bettors add a pre-bet edge estimate, a confidence rating, freeform notes on the bet’s thesis, and deposit and withdrawal tracking to reconcile true bankroll against wins and losses, a practice several sports bet tracking guides recommend for both bankroll clarity and tax reporting.
Pro Tip: Calculate CLV as a percentage, not a raw point difference: (your odds implied probability minus closing odds implied probability) divided by closing implied probability. It normalizes across odds formats and bet sizes.
Sample size matters. Positive CLV becomes a reliable signal around 100 bets, and ROI conclusions need closer to 200 bets before they mean much of anything. Fewer than that, and you’re reading noise.
How Do You Choose the Right Tracking Tool?
Run any tracker, app, or template through the same six-point check before committing time to it.
- Automation: Does it pull odds and results automatically, or require manual entry for every bet?
- CLV support: Does it capture closing odds without you hunting them down?
- Cross-book import: Can it aggregate bets from every sportsbook you use into one view?
- Security: Does it encrypt data and avoid requiring your sportsbook login credentials?
- Exportability: Can you pull your raw data into a spreadsheet if you switch tools later?
- Cost: Is the monthly fee justified by the time and errors it saves?
Ask any provider directly: How is closing line value captured, and is it automatic? Can I export everything I’ve logged? What happens to my data if I cancel?
Red flags: no export option, no visible security policy, vague or missing CLV methodology, and pricing that scales with bet volume rather than features.
Pro Tip: If a tracker can’t show you your CLV trend over the last 90 days in under three clicks, it’s not saving you the time it claims to.
As a rule of thumb: under 50 bets a year, stick with paper or a basic sheet. Between 50 and 300, a spreadsheet still works. Past 300 or across multiple books, move to a dedicated app or hybrid setup.

Copy-Ready Workflows for Each Tracking Method
You don’t need to reinvent your process, just adapt one of these four.
- Spreadsheet workflow: Log every bet the moment you place it, using a locked template with dropdown menus for sport and market type. Fill in closing odds every Sunday night for the week’s bets. Run a monthly pivot table sorting by sport, market, and sportsbook to find leaks.
- App workflow: Connect your sportsbook accounts where supported, or log bets with one tap immediately after placing them. Check the automatic CLV and profit/loss dashboard weekly rather than after every bet, which avoids overreacting to short-term swings.
- Hybrid workflow: Use an app like Betstamp or SlipSync for fast, immediate logging, then export the data monthly into a spreadsheet for custom slicing an app’s dashboard can’t do, like cross-referencing bet type against day of week.
- Custom automation: Worth building only past a few hundred bets a year or if you’re testing a systematic model. Basic components: an API pull from your sportsbooks or an odds feed, a script calculating CLV against closing lines, and an alert when CLV drops below a threshold for two consecutive weeks.
Whichever workflow you pick, common spreadsheet mistakes like logging dollars instead of units or skipping closing lines entirely will quietly wreck your analysis months before you notice.
What Does a Verified Tracking Record Actually Look Like?
Most bettors have never seen a genuinely transparent tracking record, which is exactly why so many pick services get away with cherry-picked screenshots. A transparent provider publishes a running archive showing sustained strong results across a large number of graded picks.
A monthly readout built the right way separates signal from noise. A month with negative CLV despite a winning record is a warning sign the results were lucky, not skillful. A month with positive CLV despite a losing record usually means the process is sound and variance will correct.
A transparent provider publishes every graded pick, not a curated highlight reel, and shows closing line data next to the result, not just win or loss.
Before trusting any paid tracker or evidence-based betting service, confirm it discloses full pick history, grading methodology, and CLV, not just a headline win rate.
Automatic Import and Cross-Book Aggregation
Manual re-entry is where most tracking habits quietly die. Typing the same bet twice, once into a betting app and once into a spreadsheet, adds friction that eventually gets skipped altogether. This is the exact gap automatic import solves.
Dedicated trackers connect to your sportsbooks or accept bet-slip screenshots and auto-populate the fields: odds, stake, market, and result. Some pull closing lines automatically too, which removes the single most commonly skipped field in manual logs. Automation like auto-import and automatic closing-line capture becomes the highest-value feature once you’re placing bets across more than one sportsbook regularly.
Cross-book aggregation matters more than most casual bettors realize. If you shop lines across three sportsbooks to find the best number, tracking each book separately hides your true performance. A unified view answers questions a single-book log never can: Which sportsbook gives you the best average closing line? Are you actually shopping lines, or defaulting to one app out of habit?
The tradeoff is access. Automatic import usually requires connecting sportsbook credentials or forwarding confirmation emails, which raises the security questions covered later in this piece. For bettors under 300 bets a year on a single book, manual entry into a spreadsheet is still faster to set up and just as reliable. Past that volume, or across three or more books, automated aggregation stops being a convenience and starts being the only realistic way to see your full picture.
Which Charts Actually Reveal Your Betting Patterns?
Raw numbers in a spreadsheet column tell you less than a well-built chart. Your brain catches a downward trendline in a fraction of a second; it takes minutes to spot the same pattern scanning 200 rows of profit-and-loss figures.
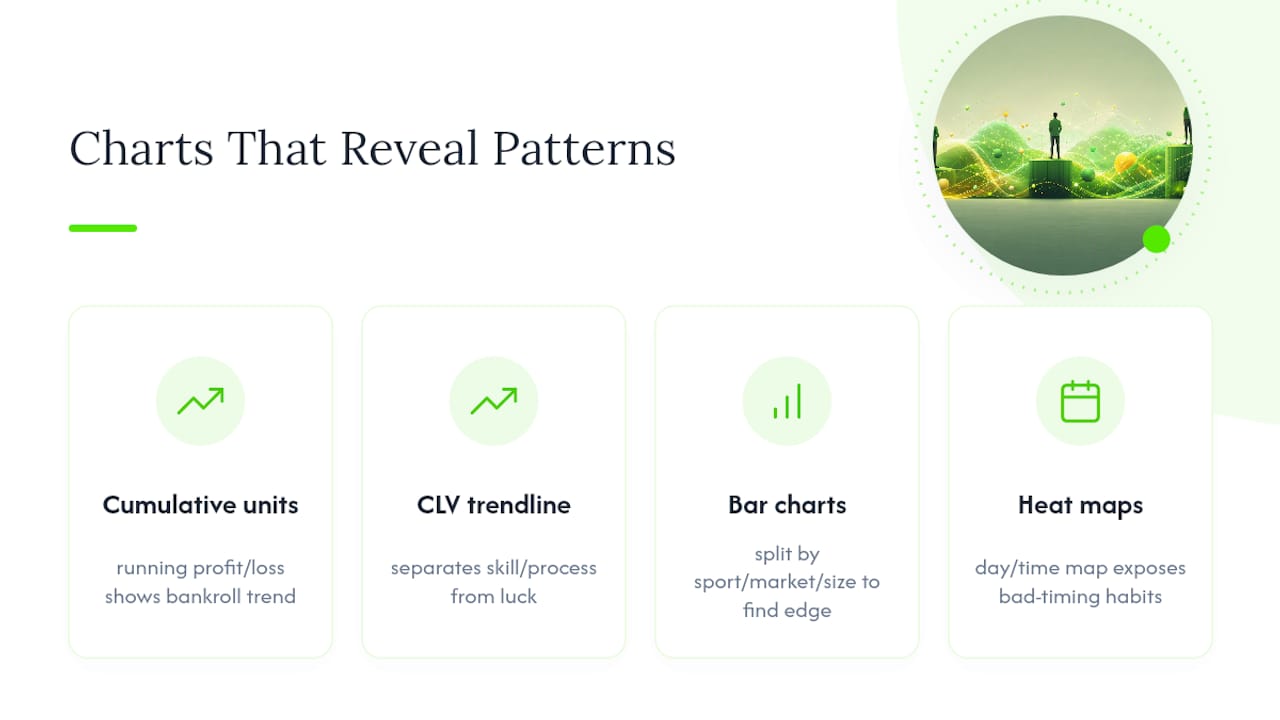
A cumulative units chart, plotting running profit or loss over time, is the single most useful visualization for any tracking method. It shows whether your bankroll trend is a slow bleed, a steady climb, or a volatile mess that needs a staking rule change. A CLV trendline run alongside it tells you whether your process or your luck is driving the results in the units chart.
Bar charts by category reveal where your edge actually lives. Split your results by sport, market type, or bet size and you’ll often find one segment carrying the entire record while another quietly drains it. A bettor who’s profitable on NFL spreads but bleeding units on player props needs to know that specific breakdown, not just an aggregate win rate.
Heat maps by day of week or time of placement can expose bad habits, like a pattern of chasing losses with late-night parlays that skew the whole month’s numbers.
Spreadsheets build these with native pivot charts. Dedicated apps like OddsJam and Betstamp generate most of them automatically inside a dashboard, which is one of the clearer arguments for upgrading once your manual chart-building starts eating real time. Either way, review these visuals on a fixed cadence, weekly for quick checks, monthly for pattern hunting, rather than only when you’re already suspicious something’s wrong.
How Should You Categorize Bets for Deeper Analysis?
A single “wins and losses” column hides more than it reveals. Categorization is what turns a flat log into an actual diagnostic tool.
Start with three layers: sport (NBA, NFL, MLB, and so on), bet type (spread, moneyline, total, player prop, parlay), and strategy or thesis (value play, model-driven, fade-the-public, live bet). Add a sportsbook column too, since line shopping only helps if you can later confirm which book actually delivered the better closing numbers.
The value shows up in cross-tabulation, not the raw categories themselves. A bettor might discover that spread bets on primetime NFL games with public double-digit favorites lose money at a rate the moneyline bets on the same games don’t. That kind of pattern is invisible in an aggregate record and obvious the moment you filter by strategy and market type together.
Keep the category list consistent from day one. A dropdown menu in a spreadsheet, or a fixed tag list in an app, prevents the slow drift where “player prop” becomes “props” becomes “PP” across different rows, which breaks any pivot table or filter built later. Dedicated apps enforce this automatically; spreadsheet users need to build it in with data validation rules from the start, not retrofit it after 200 rows are already inconsistent.
Review categorized results monthly at minimum. Weekly checks are too noisy for pattern detection at this level of granularity, since any single category might only have a handful of bets in a given week.
Is Your Betting Data Actually Safe?
Handing sportsbook login credentials to a third-party app is a bigger decision than most bettors treat it as. Before connecting any account, confirm the tracker uses read-only access or a secure API integration rather than storing your raw password.
Check whether the app encrypts data at rest and in transit, and whether it has a published privacy policy stating what it does with your betting history. A tracker that can see your stakes and win rate has a detailed financial profile of you, information you wouldn’t hand a stranger without asking questions first.
Cloud-based spreadsheets carry a different risk. Google Sheets and similar tools are generally secure at the platform level, but a shared link with the wrong permission setting can expose your entire betting history publicly. Set sharing to “restricted” by default, and never post a public link to a sheet with real financial figures in it.
A few practical habits cover most of the risk:
- Use a unique password for any tracking app, not one reused from your sportsbook login
- Enable two-factor authentication wherever it’s offered
- Review connected-app permissions on your sportsbook accounts periodically and revoke access for tools you no longer use
- Avoid trackers that ask for your sportsbook password directly instead of using a secure connection method
None of this is exclusive to betting apps. It’s the same due diligence you’d apply to any financial app that touches your money and your identity.
What Happens if You Lose Your Tracking Data?
A tracking sheet with two years of bets and no backup is one accidental deletion away from losing every pattern you’ve spent that time uncovering. Backup discipline matters as much as the logging itself.
Google Sheets keeps automatic version history, letting you roll back to an earlier state if a formula breaks or a row gets deleted by mistake. Excel users working locally should save to a cloud-synced folder like OneDrive rather than only on a laptop’s hard drive, since a single hardware failure otherwise wipes the whole record.
Dedicated apps host your data on their own servers, which removes the local-backup burden but introduces a different risk: what happens if you cancel your subscription, or the service shuts down? Before relying on any app, confirm it lets you export your full history to a CSV or spreadsheet format. If it doesn’t, treat that as a dealbreaker, not a minor inconvenience.
A simple habit covers most scenarios: export your tracking data to a spreadsheet at the end of every month, regardless of which primary method you use. That gives you a portable, timestamped backup independent of any single app’s uptime or your own hardware.
Pen-and-paper trackers face the starkest risk. A notebook has no version history and no backup unless you photograph or transcribe it periodically. If you’re using paper as your primary method, transferring entries to a digital sheet weekly is worth the extra ten minutes.
Connecting Bet Tracking to Bankroll Management
Tracking bets and managing your bankroll are two separate disciplines that too many bettors run in isolation, which is a mistake. Your bet log tells you what happened; your bankroll management rules tell you how much to risk on what happens next, and each one is weaker without the other feeding into it.
The connection point is your stake column. If you’re logging stakes in units rather than raw dollars, you can directly compare bet sizing against your bankroll rules over time, catching the moment you start sizing up during a hot streak or chasing losses with oversized bets after a bad week. That drift is nearly invisible without the two data sets side by side.
Some dedicated apps build bankroll tracking directly into the same dashboard as bet logging, showing current bankroll, unit size, and recent bet sizes together. Spreadsheet users can replicate this with a running bankroll column updated after every settled bet, plus a simple formula flagging any stake that exceeds your set unit size.
Deposit and withdrawal tracking closes the loop. Tracking transactions alongside bets shows your true bankroll trajectory, not just your betting record, which matters for tax reporting and for an honest read on whether you’re actually growing your funds or just moving money between books to chase promotions.
What Mistakes Quietly Ruin Bet Tracking Records?
Most tracking failures aren’t dramatic, they’re small, repeated errors that compound over months until the whole record is unreliable.
Skipping closing lines is the most common and most damaging mistake. Without closing odds, you can’t calculate CLV at all, which means you’re flying blind on the one metric that actually predicts long-term edge. This single omission undermines more tracking spreadsheets than any other error.
Logging only in dollars, not units, breaks any analysis once your stake sizes change over time. A $50 bet from a year ago and a $50 bet today mean different things if your bankroll has grown, but a unit-based log stays consistent regardless.
Inconsistent categories creep in over hundreds of rows: “moneyline” becomes “ML” becomes “money line” across different entries, quietly breaking every pivot table and filter built on top of the data.
Selective logging, entering wins promptly and forgetting or delaying losses, is the most self-defeating habit of all. It produces a record that flatters you and tells you nothing true about your actual performance.
Reviewing too infrequently lets small leaks turn into large ones. A monthly deep dive, backed by quick weekly checks, catches problems while they’re still cheap to fix.
The Habit That Actually Fixes Your Numbers
Two habits separate bettors who improve from bettors who stay stuck: logging the bet the moment you place it, before result bias creeps in, and recording every loss with the same honesty as every win. Selective memory is the quiet killer of most self-assessments.
If you take one thing from this article, make it small: set a recurring daily reminder, or add a home-screen widget, that nudges you to log any bet within minutes of placing it. Discipline in the moment beats good intentions after the fact every time.
— Manuel
Try Automated Tracking Built on a Verified Record
Building your own tracker takes real setup time, and even a good spreadsheet still leaves you guessing whether the picks feeding it have any real edge. Some platforms pair AI-driven picks across NBA, MLB, NFL, and more with a permanent, publicly graded archive so you can verify performance instead of taking a win rate on faith.

Some platforms cover daily picks, player props, parlays, and live in-game picks with closing-line context built into the reporting, useful for anyone who wants CLV insight without building a tracking pipeline from scratch. These services are suitable for bettors who want a verified edge to log against their own spreadsheet rather than guessing at pick quality from a stranger’s screenshots. Every graded pick stays in the archive, win or loss, so the track record can be checked rather than assumed.
See how the picks and grading process works and start a trial to track results against your own bet log this week.
Where to Learn More About Responsible Tracking
Tracking your results should also mean noticing warning signs early. The American Gaming Association publishes broader market and responsible-gaming guidance, and Gamblers Anonymous offers direct support if your logs reveal patterns that concern you.
For workflow design and safe staking habits, this skin betting workflow guide covers stake-sizing discipline that applies well beyond its niche.
- American Gaming Association: industry data and responsible-gaming standards
- Gamblers Anonymous: support for harmful betting patterns
- Safe betting workflow guide: stake-sizing and process discipline