

500+ Bets to Measure Sports Betting ROI With a Simple Spreadsheet
ROI in sports betting equals net profit divided by total amount wagered, multiplied by 100. ROI matters more than win rate because it accounts for stake size and odds, revealing whether your process actually makes money.
TL;DR:
- A consistent long-term ROI above 5% is rare and typically requires high turnover and disciplined bankroll management, especially for profits over hundreds of bets.
- Tracking ROI accurately involves excluding pushes, including juice in stakes, and standardizing odds formats to avoid calculation errors that distort results.
- Specializing in one league or bet type and focusing on positive expected value strategies significantly improve ROI over random or broad betting approaches.
- Analyzing ROI by bet type reveals that moneyline, spread, and totals often have different edge profiles, so segmentation can uncover hidden strengths or weaknesses.
- Reaching at least 500 bets is essential for reliable ROI measurement, as smaller samples are heavily influenced by luck and normal variance.
Table of Contents
- How Do You Calculate Sports Betting ROI?
- ROI vs. Yield vs. Bankroll ROI: When to Use Each
- What Counts as a Good Sports Betting ROI?
- How Many Bets Before ROI Actually Means Anything?
- Practical Tactics to Raise Your ROI
- How Do You Track ROI With a Simple Spreadsheet?
- Manny’s Variety Evidence and Author Proof Points
- How Odds Format Changes Your ROI Math
- Does Bet Type Change Your Expected ROI?
- Should You Judge ROI Over a Season or a Career?
- What Actually Moves the Needle on ROI
- Where to Find Verified Picks Backed by Real Tracking
- Sources
How Do You Calculate Sports Betting ROI?
The formula is straightforward: ROI = (Net Profit ÷ Total Amount Wagered) × 100. Net profit is what you won minus what you lost. Total amount wagered is every dollar you risked, win or lose.
Take a single bet: you stake $100 on a moneyline at -110 odds and win. Your profit is $90.91. That number looks great, but it’s meaningless in isolation. ROI only becomes useful across a sample of bets.
Here’s an aggregate example over 50 bets at $100 average stakes:
| Metric | Value |
|---|---|
| Total wagered | $5,000 |
| Total returned | $5,200 |
| Net profit | $150 |
| ROI | 3% |
That 3% ROI reflects real, sustainable performance according to the core ROI formula used by professional trackers.
Two details trip up beginners:
- Pushes: a pushed bet returns your stake with no profit or loss. Exclude the stake from both the numerator and denominator, or your ROI gets diluted.
- Juice: the vig on standard -110 lines counts as part of your risk. Always use total amount risked, including juice, as your denominator, never just the “winning” stakes.
ROI vs. Yield vs. Bankroll ROI: When to Use Each
These three terms get used interchangeably, but they measure different things.
- Wagering ROI (the standard formula above) measures profit against total money risked, bet by bet.
- Yield is functionally identical to wagering ROI in most sportsbook contexts. Some analysts distinguish it by calculating profit against stake before juice, but in practice the two terms overlap heavily.
- Bankroll ROI measures profit against your starting bankroll, not your total wagered. If you start with a $1,000 bankroll and turn a $150 profit, bankroll ROI is 15%, even if your wagering ROI was only 3%.
The gap between those two numbers comes down to turnover. That’s why turnover multiplies bankroll growth independent of how sharp your picks are. Two bettors with identical 3% wagering ROI can post very different bankroll ROI numbers based purely on how often they fire bets.
What Counts as a Good Sports Betting ROI?
Break-even bettors hover between 0% and 2% ROI, often losing to the vig without realizing it.
A wagering ROI sustained above a high single-digit percentage over hundreds of bets is sufficiently rare that most claims of it should be treated skeptically. Professional bettors typically operate closer to 2% to 5% long-term, with 5% to 8% representing genuinely strong performance.
Why does ROI cap out there for most sharp bettors? Sportsbooks limit or ban accounts that consistently beat closing lines, and market efficiency narrows edges as more sharp money chases the same inefficiencies.
Bankroll scenarios make the range concrete:
- $2,000 bankroll, $500/week turnover, 3% ROI: roughly $15 profit weekly, $780 annually.
- $5,000 bankroll, $2,000/week turnover, 5% ROI: roughly $100 weekly, $5,200 annually.
Modest ROI, applied consistently across high turnover, beats chasing an unrealistic edge.
How Many Bets Before ROI Actually Means Anything?
Variance dominates small samples. At 50 bets, a string of bad beats or lucky covers can swing your ROI by 20 percentage points in either direction. At 250 bets, that swing narrows but still misleads. At 500 bets, your ROI starts approximating your true long-term edge. At 1,000+ bets, confidence gets meaningfully higher.
Guidance from bankroll trackers puts the threshold at 500+ bets for reasonable confidence and 1,000+ for high confidence — below that, you’re mostly measuring luck, not skill.
Common mistakes that wreck ROI measurement:
- Cherry-picking a hot streak instead of reporting your full betting history.
- Counting pushes as losses, which artificially deflates ROI.
- Mixing bet types into one aggregate number instead of segmenting by sport or wager category.
- Declaring a strategy “proven” after fewer than 100 bets.
Practical Tactics to Raise Your ROI
Improving ROI isn’t about finding a secret system. It’s about tightening the fundamentals most bettors ignore.
- Fix your unit size first. Bet 1% to 3% of your bankroll per play. Oversized bets turn normal variance into account-ending drawdowns, and a brief look at Kelly Criterion sizing shows why: it scales stakes to your actual edge instead of a gut feeling.
- Shop for the best line on every bet. Holding accounts at multiple sportsbooks and taking the best number available adds measurable percentage points to ROI over hundreds of bets, according to closing line value data.
- Specialize instead of spreading thin. Deep knowledge of one league or bet type produces sharper pricing judgment than surface-level bets across ten sports.
- Hunt for positive expected value, not just picks that “feel right.” Learn how sportsbooks price probability into odds so you can spot mispriced lines instead of guessing.
- Cut parlays and high-juice props. They inflate the sportsbook’s hold and rarely pay off often enough to offset the worst odds.
- Track closing line value on every bet, not just results. CLV tells you whether your process is sound even during a losing stretch.
Pro Tip: Set a hard stop-loss for the week before you place your first bet. Deciding your limit while calm beats deciding it mid-tilt after two bad beats.
Solid bankroll management practices protect ROI more reliably than any single sharp pick, and avoiding tilt driven decisions, a pattern well documented in responsible betting behavior, keeps a good process from getting sabotaged by a bad night.

How Do You Track ROI With a Simple Spreadsheet?
Seven fields cover everything you need:
| Field | Why it matters |
|---|---|
| Date/event | Lets you segment by season, week, or matchup type |
| Bet type | Separates moneyline, spread, total, and prop performance |
| Odds (American) | Needed to calculate implied probability and payout |
| Stake/risk | The denominator for every ROI calculation |
| Closing odds | Enables closing line value tracking |
| Result | Win, loss, or push |
| Profit/loss | The raw number that rolls up into ROI |
With those seven fields logged consistently, you can compute ROI (sum profit ÷ sum stake), yield (same formula, segmented by bet type), and CLV (your odds versus closing odds, expressed as a percentage).
- Build one row per bet, never one row per parlay leg.
- Add a pivot table by sport and bet type to spot where your edge actually lives.
- Move from a spreadsheet to dedicated tracking software once you’re logging more than a few hundred bets a season. Manual entry error becomes the real risk at that volume, more than the math itself.
Reviewing tools built for this kind of betting analysis can save hours once your log outgrows a basic spreadsheet.
Manny’s Variety Evidence and Author Proof Points
Verification separates a real edge from a marketing claim. Manny’s Variety publishes a tracked record of 63.5% win rate across 1,600+ picks and a net return of 443.9 units, built on sport-specific AI engines rather than one generic model applied across every league.
That specialization matters for ROI the same way it matters for a bettor: an engine trained on NBA totals develops sharper calibration than one trying to price NBA, MLB, and NFL identically. Archived picks also double as a closing line value record. Every historical pick lets you check the line it was made against versus where the market closed, the same discipline evidence-based betting demands from any serious tracker.
How Odds Format Changes Your ROI Math
American, decimal, and fractional odds describe the same payout in three different notations, and mixing them up is a common source of calculation errors.
Decimal odds are the cleanest for ROI work. A decimal odd of 1.91 means a $100 stake returns $191 total, for $91 profit. Multiply stake by decimal odds to get total return directly.
American odds require an extra conversion step. Negative odds (-110) show how much you must stake to win $100; positive odds (+150) show how much you win on a $100 stake. To convert -110 to decimal, divide 100 by 110 and add 1, giving 1.909. Get this conversion wrong and every downstream ROI number is off.
Fractional odds, common in UK markets, express profit relative to stake as a fraction (6/4 means $6 profit per $4 staked). Converting to decimal means dividing the numerator by the denominator and adding 1.
The math itself doesn’t change your edge. What changes is error risk. Bettors who track across multiple sportsbooks using different formats without standardizing to one format before logging often introduce small, compounding calculation mistakes that distort their real ROI over hundreds of entries. Pick one format, typically decimal, convert everything into it before it hits your spreadsheet, and your numbers stay trustworthy across every sport and every book.
Does Bet Type Change Your Expected ROI?
Moneylines, spreads, and totals carry structurally different ROI profiles, and treating them as interchangeable in your tracking hides real signal.
Moneyline bets on favorites often carry lower implied ROI ceilings because the odds already price in the higher win probability. Moneyline underdogs offer higher variance and higher potential ROI, but a smaller sample makes the number far less stable.
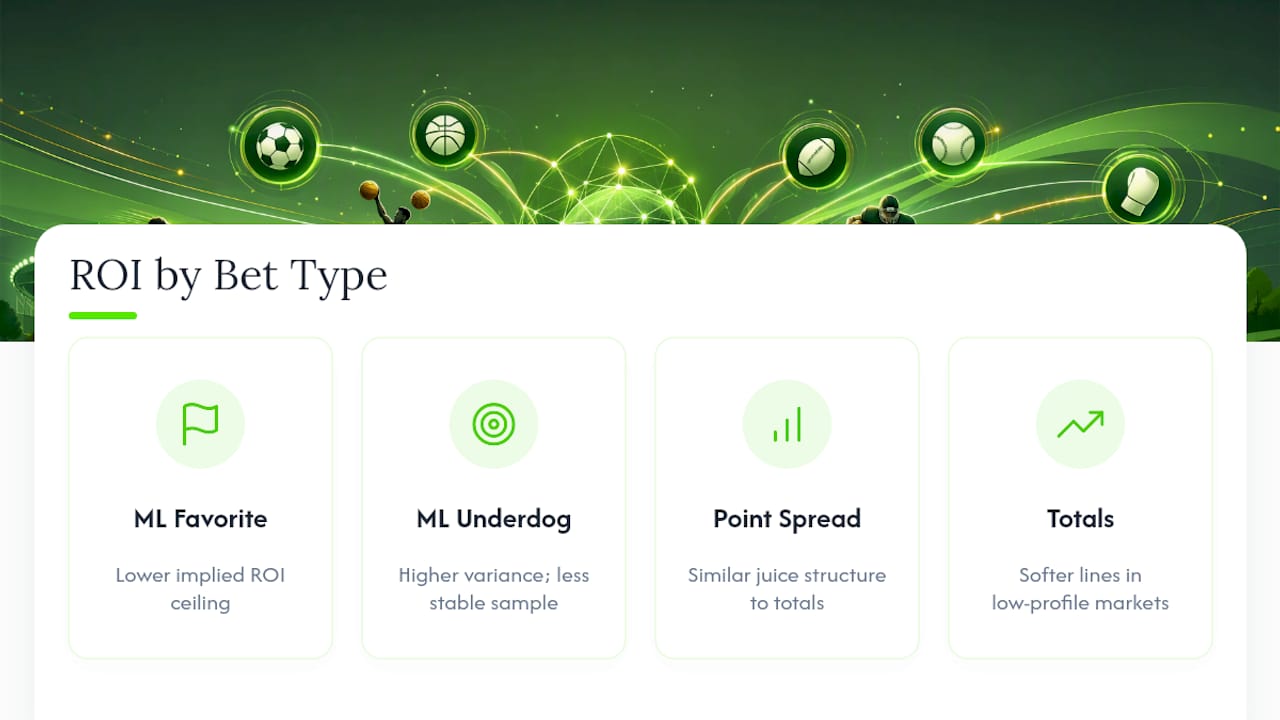
ROI here is driven almost entirely by your ability to beat the closing number, since the vig is constant.
Totals (over/under) behave similarly to spreads in juice structure but often show softer lines in lower-profile games or markets, like college basketball totals versus primetime NFL. That softness can translate into a real ROI edge for bettors willing to specialize there.
Segmenting your tracked ROI by bet type, rather than reporting one blended number, often reveals that your moneyline picks are dragging down an otherwise strong spread record, or the reverse. That segmentation is one of the most overlooked adjustments a bettor can make, and it costs nothing beyond adding one column to your spreadsheet.
Should You Judge ROI Over a Season or a Career?
Short-term ROI, anything under a few hundred bets, tells you almost nothing reliable about your actual edge.
Long-term ROI, tracked across 500 to 1,000+ bets, is the number that reflects your real process.
The practical implication: don’t evaluate a betting strategy, or a tipster, on a hot month. Don’t abandon a sound process after a cold week either. The frustrating part of sports betting is that the sample size needed to know the truth is often longer than most bettors have the patience to track.
Plan your bankroll and your expectations around the long-term number, not the streak you’re currently riding.
What Actually Moves the Needle on ROI
Most betting content treats ROI like a scoreboard, something to brag about after a good week. That framing is backwards. ROI is a diagnostic tool, and it only works as one when you have enough bets logged to trust it.
The conventional advice, “just find better picks,” undersells how much of ROI comes from process discipline: unit sizing, line shopping, and tracking closing line value religiously. A bettor with a mediocre pick rate but disciplined bankroll management and consistent line shopping will out earn a “sharp” bettor who ignores those fundamentals over a long enough sample.
If you take one thing from this guide, make it sample size. Don’t trust any ROI number, yours or anyone else’s, under 500 logged bets. Build the tracking habit before you worry about optimizing the picks themselves. The habit is what turns betting from gambling into something closer to a measurable skill.
— Manuel
Where to Find Verified Picks Backed by Real Tracking
Everything in this guide points to one conclusion: ROI only means something when it’s tracked honestly, over enough volume, with a documented process behind it. That’s the exact gap Manny’s Variety was built to close. Instead of relying on gut picks or unverifiable tipster claims, Manny’s Variety runs sport-specific AI engines across MLB, NBA, NFL, NHL, PGA, MMA, and soccer, with every pick permanently archived for public grading.

That transparency matters because it lets you check closing line value on historical picks yourself, rather than taking a win rate on faith. The platform’s live in-game picks extend that same process to real-time markets, where lines move fast enough that manual tracking falls behind. If you’re an amateur bettor trying to build the sample-size discipline this article recommends, start with a free trial and see how the archived track record holds up against your own spreadsheet.
Sources
- Sports Betting ROI Calculator: How to Track Your Real Return | Market Math
- Sports Betting ROI Calculator: Free Tool + 2026 Realistic Benchmarks