

Betting Model Validation: Clear the 3 Gates Most Bettors Skip
Validate a betting model with time-ordered walk-forward tests, proper probability scoring, and per-fold economic reporting, never with a single shuffled backtest. A model passes only when it clears three gates together: stable calibration error across folds, positive closing-line value on out-of-sample data, and a bootstrap confidence interval on yield that excludes catastrophic loss. Miss any one gate and the “edge” is probably noise wearing a lab coat.
TL;DR:
- Proper validation requires multiple walk-forward folds with at least 500 settled bets across a year, and includes per-fold metrics and bootstrap confidence intervals on yield.
- Backtesting must simulate actual market conditions, including commission, bet limits, bankroll tracking, and correlated resampling to accurately reflect real-world risk and variance.
- Calibration of probabilities, assessed through proper scoring rules and reliability diagrams, is often more critical than raw accuracy and should be recalibrated on inner validation sets to avoid leaks.
- Relying solely on prediction accuracy or a single backtest is insufficient; multiple folds, robustness tests, and external domain knowledge are essential to confirm a model’s edge.
- Continuous monitoring of calibration, CLV, and market conditions, with versioned reports and explicit criteria for model retirement, helps maintain a reliable betting edge over time.
Table of Contents
- What Makes Betting Model Validation Different From Standard ML Testing
- Designing and Running Walk-Forward Validation
- Backtesting That Mimics Market Reality
- Probability Quality: Scoring Rules, Calibration, and Recalibration
- Economic Metrics and Staking: CLV, EV, Drawdown, and Kelly Pitfalls
- Robustness Testing: Sensitivity, Jitter, and Stress Scenarios
- Reproducible Reporting and Minimum Evidence Floors
- Applied Example: How Manny’s Variety Presents Validation Artifacts
- Discussion of Validation Dataset Selection and Splitting Strategies Specific to Betting Data
- Handling Concept Drift and Adapting Models to Changing Sports/Betting Markets
- Integration of Domain Knowledge and External Data Sources in Model Validation
- Common Pitfalls and Biases Unique to Betting Model Validation
- Guidelines for Updating and Maintaining the Validation Process Over Time
- The Trade-Off Between Perfect Validation and Getting In the Game
- See the Kind of Evidence Manny’s Variety Publishes
- Sources
- FAQ
What Makes Betting Model Validation Different From Standard ML Testing
Standard machine learning validation assumes your data points are independent and identically distributed. Betting data breaks that assumption on purpose. Games cluster by season, injuries ripple across a roster for weeks, and a market’s closing line already contains the wisdom of thousands of other bettors before you ever place a wager.
That temporal structure is why random train/test splits are close to useless for betting model validation. A model trained on shuffled data can peek at information from the future relative to any given test point, a leak that inflates apparent skill. The fix is to respect a decision timestamp: the exact moment your model would have had to commit to a prediction, using only data available up to that second.
The market itself sets the real baseline. Closing odds reflect the collective judgment of sharp money and public volume alike, and beating that closing line consistently is a stronger signal of skill than beating a naive coin-flip prior. Every sportsbook also bakes in vigorish, the built-in commission that means a bettor needs a real edge just to break even, not merely to guess the outcome correctly more than half the time. That is why raw prediction accuracy is close to meaningless on its own.
A few terms carry the rest of this article, so it helps to fix them now:
- Calibration: whether a predicted 70% probability actually wins about 70% of the time across many bets.
- Closing-line value (CLV): how your bet’s odds compare to the closing odds, the standard proxy for genuine predictive skill.
- Expected value (EV): the theoretical average profit per unit staked, given true win probability and offered odds.
- Brier score and log loss: proper scoring rules that penalize confident, wrong predictions harder than accuracy alone ever does.
Walk-forward validation exists specifically to respect this timeline, and it’s the backbone of every method that follows.
Designing and Running Walk-Forward Validation
Walk-forward validation answers a single practical question: if you had trained your model only on data available at the time, how would it have performed on what came next? That framing matters more than any specific window size, because it forces every design choice back toward realism instead of convenience.
Here is a repeatable protocol for running it on a betting model:
- Fix the prediction horizon. Decide exactly when a prediction gets locked in, for example two hours before kickoff, and never let features drift past that timestamp.
- Choose expanding or rolling windows. Expanding windows keep all prior history and grow the training set each fold; rolling windows drop old seasons to track rule changes, roster turnover, or shifting play styles. Sports with fast rule or roster churn (arena leagues, early-season NFL) often favor rolling windows; deep-history markets like MLB tolerate expanding windows better.
- Insert a gap where needed. If any feature (like a rolling average) takes days to fully update, add a buffer between training and test folds so no half-formed data leaks across the boundary.
- Tune only inside training folds. Hyperparameter search and feature selection happen entirely within the training window of each fold; touching test-fold data at this stage is the single most common leak in amateur validation.
- Nest your calibration step. Fit any probability calibrator (isotonic regression or Platt scaling) on an inner validation slice carved from the training fold, never on the outer test fold itself.
- Log everything per fold. Record log loss, Brier score, calibration error, CLV, ROI, bet count, and a bootstrap confidence interval for each individual fold before you ever average across folds.
Skipping straight to an averaged headline number is how mediocre models get funded. The Wager Theorem’s own comparison found a naive shuffled split showing +4.2% ROI on a model that produced negative 1.8% ROI once tested under proper walk-forward conditions. Same data, same model, opposite conclusion.
Pro Tip: Never trust a single-fold result, no matter how good it looks. Require multiple independent folds before you let a model anywhere near real stakes, and treat very small folds as informative but not decisive.
Backtesting That Mimics Market Reality
A backtest is only as honest as its market simulation. Replay every bet at its actual decision timestamp, using odds that were genuinely available at that moment, not the closing line and not some averaged “best price” pulled from hindsight.
Realistic backtesting requires a few non-negotiable mechanics:
- Commission modeling. Apply vig or exchange commission the same way a live sportsbook or exchange would, market by market, rather than assuming flat theoretical prices.
- Rejection and limit simulation. Sharp models get limited or rejected at soft books; a backtest that assumes unlimited action at every price is fantasy, not evidence.
- Chained bankroll across folds. When you evaluate rolling windows sequentially, carry the bankroll forward fold to fold so early-stage ruin actually shows up in the equity curve instead of resetting to a clean slate each time.
- Correlated resampling for confidence intervals. Bootstrap by resampling entire matches, not individual bets, since two bets on the same game share outcome risk; resampling bets alone understates true variance.
The betting-backtester project on GitHub implements exactly this combination: a walk-forward evaluator, Betfair-style commission handling, and bootstrap confidence intervals on yield built from match-level resampling rather than bet-level resampling.
The bootstrap CI on that yield spanned -15.85% to +5.56%, a range wide enough to include both modest profit and near-total loss. The headline number lied. The confidence interval told the truth.
Probability Quality: Scoring Rules, Calibration, and Recalibration
Accuracy asks whether you picked the right side. Calibration asks whether your confidence level was honest. For betting model validation, calibration usually matters more, because stake sizing depends entirely on how much you trust a stated probability.
Two proper scoring rules do the heavy lifting here:
- Brier score: the mean squared error between predicted probability and actual outcome (0 or 1), decomposable into calibration and resolution components.
- Log loss: penalizes confident wrong predictions much more severely than Brier score, which makes it useful for catching a model that is occasionally very sure and very wrong.
Both scores can look similar for two very different models, one well-calibrated with modest discrimination, one sharp but systematically overconfident. That’s why a calibration plot, sometimes called a reliability diagram, is the diagnostic tool that actually separates them. Bucket predictions into probability bins (0 to 10%, 10 to 20%, and so on), plot each bin’s average predicted probability against its actual observed win rate, and look for how far the curve strays from the 45 degree line. That deviation, averaged and weighted by bin size, is the expected calibration error (ECE).
Recalibration, typically isotonic regression or a simple logistic (Platt) rescaling, can meaningfully close that gap. Research on scoring rules in sports prediction notes that recalibration often reduces ECE substantially when the underlying model has real signal but poor probability output. The catch: fitting that calibrator on the same data you’ll use to judge the model is a leak. Always fit it on a nested inner-validation slice, then evaluate it, untouched, on the outer test fold.

Pro Tip: If your model’s discrimination (its ability to separate winners from losers) is decent but its Brier score is mediocre, check calibration before you touch the model architecture. A miscalibrated but accurate model. is often one recalibration step away from being usable; a rebuilt architecture rarely fixes a probability problem that recalibration would have solved in an afternoon.
Calibration is frequently the actual weak point in sports prediction models, not raw predictive skill, which is why this step deserves more attention than most validation write-ups give it.
Economic Metrics and Staking: CLV, EV, Drawdown, and Kelly Pitfalls
Probability quality means nothing until it survives contact with a staking plan. Four economic metrics translate calibration into money:
- Closing-line value (CLV): the gap between your bet’s price and the closing price; positive CLV across many bets is the strongest available proxy for real skill, because the closing line absorbs nearly all public and sharp information.
- Expected value (EV): the theoretical per-bet profit implied by your model’s probability and the offered odds, useful for ranking bets before you place them.
- Turnover: total volume wagered, which determines how sensitive your realized results are to variance versus how sensitive they are to your actual edge.
- Maximum drawdown: the largest peak-to-trough decline in bankroll, the number that determines whether you can psychologically or financially survive a bad stretch.
Kelly staking sizes bets proportional to edge and odds, and it is mathematically optimal for long-term bankroll growth, assuming your probabilities are correct. That assumption is the entire problem. Kelly amplifies whatever error already lives in your calibration. A model that’s overconfident by even a modest margin will get sized up by full Kelly into bets that are actually smaller edges (or losing propositions) than advertised, which is exactly the mechanism behind the 98% bankroll loss described earlier despite a yield near zero.
Fractional Kelly (commonly a quarter or half of full Kelly) or a flat exposure cap per bet dramatically reduces this amplification risk while sacrificing only a modest amount of theoretical growth rate. Manny’s Variety’s guide to Monte Carlo betting walks through how miscalibrated inputs interact with staking math, and the bankroll management framework covers practical exposure limits worth setting before you ever size a bet with real money.
Report probabilistic metrics and economic metrics side by side, always. A model with excellent calibration but negative CLV isn’t deployable, and a model with strong CLV but wide, unexplained calibration error probably got lucky on outcome sequencing rather than genuinely reading the market.
Robustness Testing: Sensitivity, Jitter, and Stress Scenarios
A model that only survives under its exact original parameters and exact historical conditions isn’t robust, it’s memorized. Robustness testing exists to find the fragile ones before real money finds them for you.
- Parameter jitter. Nudge key hyperparameters by small amounts (5 to 10%) and retrain. A model whose performance collapses under tiny nudges was likely overfit to noise in the original configuration, not signal in the data.
- Retrain-stability checks. Retrain the same architecture on slightly different but overlapping data windows. Wildly different feature importances or predictions across retrains is a red flag for instability.
- Regime-shift stress tests. Simulate conditions like a rule change, a shortened season, or a sudden shift in market efficiency, then measure how drawdown and CLV behave under that shift rather than under normal conditions.
- Missing-data stress tests. Deliberately blank out a feature the model normally relies on (like a key injury report) and confirm performance degrades gracefully rather than catastrophically.
Set a quantitative bar before you run any of this: a model that passes should show calibration error and CLV that stay within a reasonably narrow band under jitter, retrains, and stress conditions, not identical, but not wildly divergent either. If a 5% parameter nudge flips a model from profitable to catastrophic, that model was never actually profitable. It was a fitted coincidence.
Reproducible Reporting and Minimum Evidence Floors
Validation that isn’t published in enough detail to audit isn’t validation, it’s a claim. A useful evidence floor looks like this:
- At least 500 total settled bets across the full evaluation period.
- At least 3 independent, non-overlapping folds.
- At least 365 days spanning the first and last scored window.
- Published counts of eligible, predicted, and settled bets, broken down by league and by fold.
These are recommended floors, not statutory minimums, but validation reports that fall well short of them (say, 80 bets across a single 6-week window) deserve real skepticism regardless of how good the headline number looks. Manny’s Variety’s own breakdown of sample size in sports betting goes deeper into why bootstrap confidence intervals shrink slowly, not linearly, as bet counts grow.
Beyond bet counts, a genuinely reproducible report publishes its feature schema (what data was available and exactly when), the cutoff timestamps used for each decision point, the calibrator artifact and the window it was trained on, per-fold metrics rather than only an average, bootstrap confidence intervals, and any exclusions applied to the data along with the reason for each one.
| Evidence Element | Minimum Standard |
|---|---|
| Total settled bets | 500+ |
| Independent folds | 3+ |
| Calendar span | 365+ days |
| Reporting granularity | Per-fold, not just aggregate |
| Confidence intervals | Bootstrap CI on yield, required |
A short automation checklist keeps this reproducible release over release: version every model artifact with a timestamp and training-window record, lock the feature schema before each new fold runs, and archive raw predictions alongside outcomes so any published metric can be recalculated independently later.
Applied Example: How Manny’s Variety Presents Validation Artifacts
A permanent pick archive with timestamps attached to every entry is published, which is the same raw material a fold-level validation report is built from. Subscribers can see individual picks logged before results were known, aggregated performance across sports, and unit-based returns rather than a single vague win rate.
Those numbers only carry weight because they’re tied to individually dated, publicly viewable picks rather than an unverifiable summary claim.
The practical use for a data-savvy bettor is to treat these public reports the way you’d treat any fold in your own validation pipeline: check the sample size, check the calendar span the picks cover, and check whether performance holds up across sports rather than concentrating in one favorable stretch. That’s how you audit a public track record instead of just trusting the headline number.
Discussion of Validation Dataset Selection and Splitting Strategies Specific to Betting Data
Choosing what goes into your validation dataset matters as much as choosing how to split it. A dataset drawn only from a single league’s regular season will validate cleanly against itself and then fall apart the moment playoff intensity, roster shortening, or tanking incentives shift the underlying dynamics.
Splitting strategy needs to match the question you’re actually asking. If you want to know whether a model generalizes across seasons, split by season boundary, never by random row. If you want to know whether it holds up mid-season as injuries accumulate, use rolling windows within a season rather than one clean pre/post split. Cross-sport or cross-league validation deserves particular caution: a model tuned on NBA totals and then tested on WNBA or international leagues is really testing transfer learning, not the original model, and should be labeled that way in any report.
Class imbalance is a quieter trap. Moneyline favorites, for instance, dominate raw win counts even though they’re rarely the profitable side of a market. A validation split that doesn’t stratify by odds range or bet type can produce metrics that look strong purely because heavy favorites won most of their games, not because the model found genuine mispricing anywhere in the distribution.
The safest general rule: split along the same axis that concept drift will eventually attack, whether that’s calendar time, league, or bet type, so your validation actually rehearses the failure mode you’re most worried about in production.
Handling Concept Drift and Adapting Models to Changing Sports/Betting Markets
Sports markets drift constantly. Rule changes (a new pitch clock, a revised playoff format), roster turnover, and even shifts in how efficiently the market itself prices information all erode a model’s edge over time, often quietly.
The first defense is monitoring, not retraining. Track calibration error and CLV on a rolling basis in production, not just at initial validation. A gradual rise in ECE or a slow fade in CLV is the earliest reliable signal that drift has started, well before raw ROI turns negative.
Rolling or expanding windows handle slow drift reasonably well on their own, since old, less-relevant data eventually ages out or gets diluted by newer patterns. Sudden drift, like a mid-season rule change or a major roster shakeup, needs a faster response: a shortened retraining window triggered manually rather than waiting for the next scheduled retrain cycle.
Resist the urge to retrain on every noisy losing stretch. Distinguishing genuine drift from ordinary variance is exactly what your bootstrap confidence intervals are for. If a downturn sits comfortably inside the CI your validation already established, it’s probably normal variance, not drift, and retraining in response just adds instability without fixing anything real.
Integration of Domain Knowledge and External Data Sources in Model Validation
Pure statistical validation misses failure modes that domain knowledge catches immediately. A model that shows strong backtested numbers but relies on a feature no serious bettor would trust, like a stale injury designation or a lineup that wasn’t actually confirmed at decision time, is a model validated against fantasy data, not reality.
External data sources deserve the same timestamp discipline as anything modeled internally. Weather feeds, injury reports, lineup confirmations, referee assignments, even travel schedules all need explicit availability timestamps declared before they enter a feature set. A join that pulls “the injury report” without pinning it to the exact hour it was published is a common, subtle leak, because injury reports get updated repeatedly right up until game time.
Domain expertise also helps set sanity bounds on validation results themselves. Real edges in mature markets tend to be small and hard-won; a huge apparent edge is far more likely to signal a leak or an overfit than a genuine market inefficiency the entire betting public somehow missed.
Sport-specific knowledge should shape which validation checks matter most. Baseball’s long season and large sample sizes tolerate more aggressive statistical testing than a sport like the NFL, where a single season provides barely enough games to support a handful of walk-forward folds at all.
Common Pitfalls and Biases Unique to Betting Model Validation
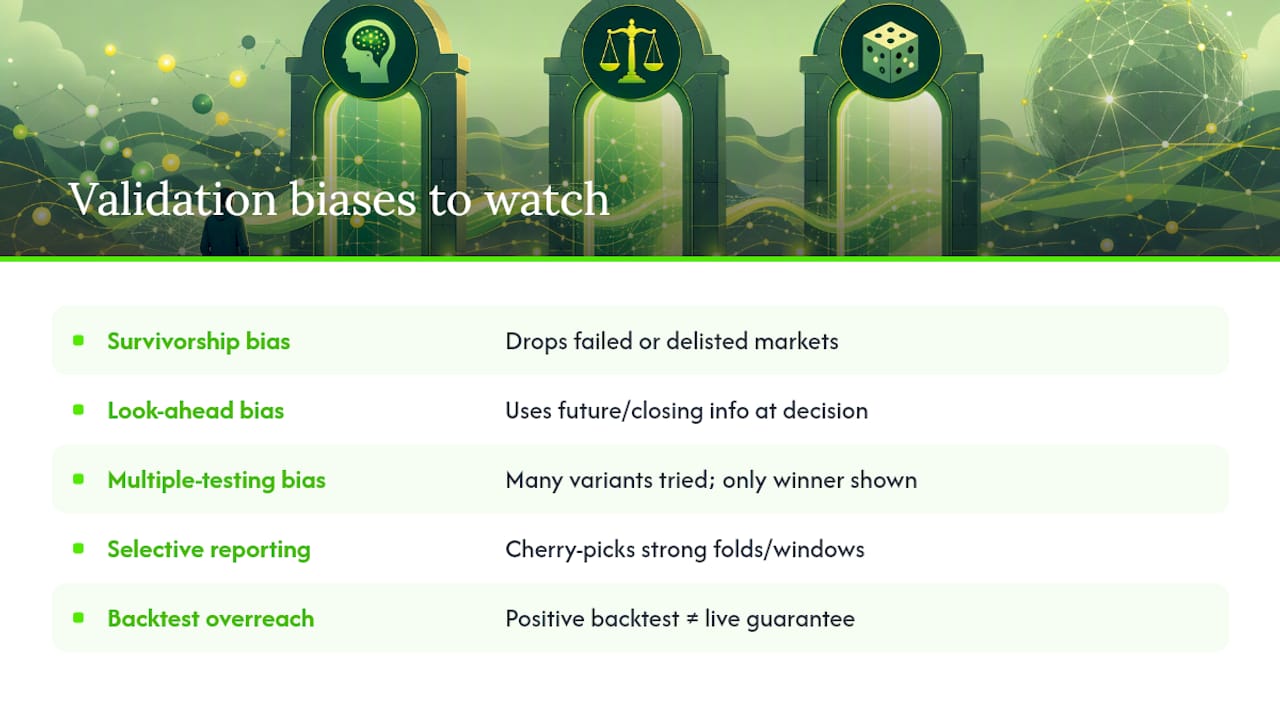
Survivorship bias shows up constantly in backtested betting data. If your historical dataset only includes markets or bet types that existed and were liquid throughout the full test period, you’ve silently excluded the failed markets, the delisted prop types, and the leagues that folded, which flatters your results in ways that are almost invisible unless you go looking for them.
Look-ahead bias through feature engineering is the single most common technical leak. A rolling average that includes the game being predicted, a team-strength rating recalculated after results are known, or a merge that grabs the closing line instead of the line available at your actual decision timestamp will all inflate performance in ways that vanish the moment the model goes live.
Multiple-testing bias creeps in when you try dozens of feature combinations, staking rules, or model architectures and report only the best-performing configuration as though it were your single hypothesis all along. Each additional variant you test raises the odds that something looks good purely by chance; a validation report should disclose how many configurations were tried, not just the winner.
Selective reporting, publishing the strong stretch and quietly omitting the weak one, is the human version of the same problem. This is precisely why per-fold reporting and bootstrap confidence intervals matter so much: they make it structurally harder to cherry-pick a favorable window and call it representative.
Finally, treating a positive backtest as proof rather than evidence is a bias in itself. Walk-forward results estimate how a model would have performed. They don’t guarantee how it will perform, especially once real-world execution frictions like limits, delayed odds, and rejected bets enter the picture.
Guidelines for Updating and Maintaining the Validation Process Over Time
Validation isn’t a one-time gate you pass before deployment; it’s a maintenance cycle that needs its own schedule. A reasonable cadence is a full re-validation at the start of each season or major schedule change, with lighter rolling checks (calibration and CLV monitoring) running continuously in between.
Version everything. Every model artifact, every calibrator, and every feature schema should carry a version tag and a timestamp so you can trace exactly which configuration produced any given batch of live predictions. Without versioning, a performance drop becomes nearly impossible to diagnose, because you can’t isolate whether the model changed, the data pipeline changed, or the market changed.
Set explicit retirement criteria before you need them, not after a losing streak forces a panicked decision. A reasonable rule: if calibration error trends outside its validated range for two consecutive monitoring windows, or if live CLV turns persistently negative across a large enough sample to rule out normal variance, the model goes back into the validation pipeline rather than staying live on hope.
Keep a change log alongside your version history. Note what changed, why, and what the pre and post validation metrics looked like for that change. Over a few seasons, that log becomes its own diagnostic tool, showing which types of updates historically helped and which ones quietly degraded performance despite looking reasonable at the time.
The Trade-Off Between Perfect Validation and Getting In the Game
Full validation rigor, multiple folds, bootstrap CIs, robustness stress tests, takes real time and data most independent bettors don’t have in abundance. At some point you have to decide whether the evidence is strong enough to justify a small, low-exposure live trial rather than another six months of backtesting.
Accept provisional evidence when calibration looks stable across at least a couple of folds and CLV is positive, even if the confidence interval is still wide. Run that trial at a fraction of normal stakes, treat it as an extension of your validation process rather than a victory lap, and keep collecting fold-level data the entire time.
Data availability is usually the real constraint, more than modeling skill. If your feature pipeline can’t reliably timestamp injury or lineup data, fix that before you fix the model architecture. A better model built on leaky data is still a leaky model.
— Manuel
See the Kind of Evidence Manny’s Variety Publishes
The platform provides a public, timestamped pick archive you can actually audit instead of a promised backtest you have to take on faith.

If you want to see how that reporting looks in practice, browse the game analysis and matchup breakdowns for a sense of the depth behind each pick, or check how the platform generates its daily picks across NBA, MLB, NFL, and other sports. For bettors who want live, in-game predictive output rather than pregame picks alone, the live picks page is the place to start a trial and see the artifacts firsthand.
Sources
Four resources cover the practical core of this article. The Wager Theorem’s walk-forward guide lays out the protocol and timestamp discipline in detail. The betting-backtester repository is an implementable Python framework with bootstrap CIs and commission modeling built in. The sports betting textbook chapter on model evaluation covers scoring rules and calibration theory. FootballProofAI’s validation research sets minimum evidence floors worth adopting as a default standard.
FAQ
What Is the Single Most Important Test in Betting Model Validation?
Walk-forward validation is the foundation, since it’s the only method that respects the timestamp your model would have actually had to predict from, but it needs calibration checks and economic metrics alongside it to be conclusive.
How Many Bets Do I Need Before I Trust a Backtest?
A reasonable floor is a few hundred settled bets across multiple independent folds spanning a substantial period, though wider bootstrap confidence intervals below that threshold should make you more cautious, not more confident.
Why Does a Model With Good Accuracy Still Lose Money?
Accuracy ignores calibration and the vig; a model can call the right side of a game consistently while still being overconfident on its probabilities, which sizes bets incorrectly and erodes bankroll even on a winning record.
Is Full Kelly Staking Safe for a Validated Model?
No model’s probabilities are perfectly calibrated, and full Kelly amplifies whatever error remains, which is why fractional Kelly or a flat exposure cap is the safer default even after a model clears validation.
How Can I Check a Public Track Record Like Manny’s Variety’s?
Look at whether picks are timestamped before results, whether the sample spans enough bets and enough calendar time to matter, and whether performance holds up across sports rather than concentrating in one lucky stretch, the same audit standard this article applies to any model’s own validation report.