

Contrarian Betting: How to Fade the Public and Win
Contrarian betting means deliberately wagering against heavy public action when specific market signals show the public has pushed the price out of value. It is not a blanket rule to bet the opposite of everyone else. The strategy produces a measurable edge only when specific filters align: a very high percentage of public tickets on one side, a confirming signal such as reverse line movement (RLM) or a clear ticket/handle divergence, and a coherent reason why the public has mispriced the game.
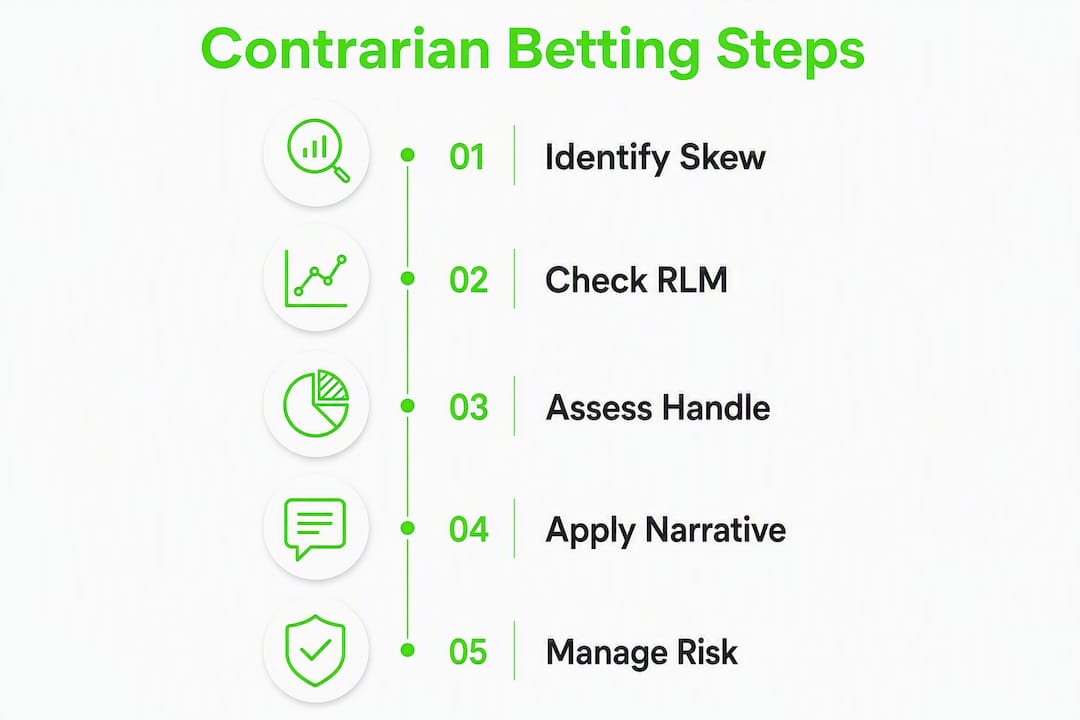
Minimum conditions before placing a contrarian bet:
- Public ticket percentage is 70% or higher on one side
- Handle (dollar volume) does NOT match the ticket skew, or the line is moving against the public
- At least one confirming signal is present: RLM, steam from the sharp side, or high closing line value (CLV) potential
- A narrative reason exists for why the public is wrong (injury misread, rest/schedule edge, primetime bias)
Quick example: a primetime NFL game shows 78% of tickets on the favorite, but the spread has dropped from -7 to -6.5. That is a textbook fade setup. A game where 75% of tickets AND 80% of the handle sit on the same side? Pass. Sharp money is reinforcing the public there, not opposing it.
Table of Contents
- How contrarian betting works: market mechanics and bookmaker reactions
- What contrarian strategies actually look like in practice
- What signals and thresholds indicate real contrarian value
- Risk management when fading the public
- What tools and data sources support a contrarian workflow
- How Mannysvariety applies contrarian signals with verified results
- Key Takeaways
- Why most bettors misuse the contrarian approach
- Mannysvariety puts contrarian signals to work for you
- Useful sources and further reading
How contrarian betting works: market mechanics and bookmaker reactions
Sportsbooks do not simply take bets and hope for balance. When recreational money stacks heavily on one side, books adjust the line to attract action on the other side and manage liability. That adjustment is the signal contrarian bettors watch for, because it reveals where the book needs help and, more importantly, where sharp bettors are positioned.
Two numbers matter in every betting split: ticket percentage and handle percentage. Ticket percentage counts the number of individual bets placed on each side. Handle percentage measures the total dollar volume. A side can carry 70% of tickets but only 30% of the handle, which tells you that many small recreational bettors are on one side while fewer, larger bets sit on the other. That divergence is the earliest warning sign that sharp money is opposing the crowd.
Reverse line movement (RLM) is the clearest confirmation. When 70%+ of tickets are on Team A and the line moves in favor of Team B, the book is not chasing public money. It is responding to sharp action on Team B. RLM combined with a heavy public ticket skew produces the strongest contrarian confirmation, with historical studies indicate contrarian plays can produce above-average ATS win rates.
Steam refers to rapid, coordinated line movement across multiple books simultaneously, usually triggered by a sharp syndicate. A line that refuses to move at all despite massive public support is a different signal: the book is comfortable holding that exposure, which can mean the public side is not as vulnerable as the ticket count suggests.
Pro Tip: Read the handle before the tickets. A 70% ticket skew with only 40% of the handle is a much stronger fade signal than a 70% ticket skew with 65% of the handle. The dollar split tells you where the informed money went.
Here is how to read two common scenarios:
- Fade justified: 74% of tickets on the road favorite, line moves from -3.5 to -3. Handle shows only 45% on that same side. RLM plus ticket/handle divergence. All three signals align. Fade the favorite.
- Fade not justified: 72% of tickets on the home team, handle shows 68% on the same side, line moves from +2.5 to +3. Sharp money is reinforcing the public. The line moved with the public. No fade.
Professional bettors treat “fade the public” as a diagnostic process, not a slogan. The question is always: why is the public wrong on this specific game?
What contrarian strategies actually look like in practice
The most common contrarian plays fall into four categories. Each has a specific structure and a specific failure mode.
1. Fading public favorites against the spread (NFL)
NFL primetime games draw the heaviest recreational action of any sport. The public consistently overvalues nationally televised teams, star quarterbacks, and recent momentum. Fading a primetime favorite laying 7+ points, when RLM is present, is one of the most documented contrarian edges. NFL contrarian ATS win rates are among the highest per bet because the public’s primetime bias is systematic and predictable. For deeper NFL modeling context, Mannysvariety’s NFL prop betting analysis shows how sport-specific signals translate into specific bet types.

2. Backing contrarian underdogs on the moneyline (MLB)
MLB is a volume sport. A contrarian moneyline bettor backing +150 underdogs with a 45% win rate still profits because the plus-money payouts outpace the losses. MLB contrarian moneyline plays can net positive units even with sub-50% win rates precisely because of this asymmetry. The MLB betting models framework explains how to identify which underdogs carry genuine value versus which are simply cheap.
3. Fading overs in primetime totals
The public bets overs at a disproportionate rate, especially in high-profile games. Casual bettors want action and scoring. When a total has 75%+ of tickets on the over and the line ticks up, the under becomes the contrarian play. Weather, pace of play, and defensive matchups often explain why the public over-inflated the total.
4. Late-money timing plays
Sharp bettors often wait until 30–60 minutes before kickoff to place large wagers, minimizing the time books have to adjust. Monitoring line movement in that final window can reveal late steam that confirms or contradicts the earlier contrarian setup.
What to avoid:
- Fading a game where both ticket % and handle % favor the same side heavily (sharp money is with the public)
- Applying contrarian logic to low-volume markets where a single large bet can distort splits
- Treating any public skew below 65% as a meaningful contrarian signal
- Fading a team with a genuine informational edge the public actually has (a key injury that broke late and is widely known)
What signals and thresholds indicate real contrarian value
Tracking one metric in isolation is how bettors lose money on contrarian plays. The edge comes from signal combination. Here is the core set to monitor and how to interpret each:
| Metric | What it implies | Suggested action |
|---|---|---|
| Public ticket % ≥ 70% | Recreational skew; potential value on the other side | Flag for further review |
| Handle % diverges from ticket % | Sharp money opposing the public | Elevate to active watch |
| Reverse line movement (RLM) | Book responding to sharp bets against the public | Strong confirmer; consider bet |
| Ticket % and handle % both ≥ 70% same side | Sharps reinforcing public; no fade edge | Pass |
| Steam (rapid multi-book movement) | Syndicate action; directional signal | Follow direction of steam |
| Closing line value (CLV) positive | Bet was placed at better price than close | Process validator over time |
The 70% ticket threshold is a starting filter, not a trigger. Blind fading at lower thresholds produces roughly break-even results after vig—about a 52.4% win rate at -110 odds. The confirming signals are what separate a real edge from noise.
Signal weighting works like this: RLM is the highest-weight confirmer. A ticket/handle divergence is the second. A coherent narrative (schedule, rest, injury misread) is the third. The best contrarian setups combine extreme public skew, RLM, and a clear reason why the public misread the game. Two of the three signals is a reasonable threshold for a standard unit bet. All three justifies a larger stake within your plan.
Pro Tip: Track CLV on every contrarian bet you place. If you consistently beat the closing line, your process is finding real value. If you beat win rate but miss CLV, you are getting lucky, not good.
Risk management when fading the public
Contrarian betting produces losing streaks. That is not a flaw in the strategy. It is a structural feature. When you fade the public, you are often backing the side with less media narrative and less emotional momentum. Those bets lose in clusters, especially in the NFL when a public team runs hot for several weeks.

At standard -110 odds, a bettor needs a 52.4% win rate just to break even. A contrarian strategy targeting 57–59% ATS win rates has genuine theoretical upside, but only if staking is disciplined enough to survive the variance.
Staking guidance:
- Flat betting (1–2 units per game): The most practical approach for most bettors. It limits downside during losing streaks and keeps the sample size meaningful.
- Kelly Criterion basics: Kelly sizes bets proportionally to perceived edge. Full Kelly is aggressive; most practitioners use quarter-Kelly or half-Kelly to reduce variance. For a perceived 55% edge at -110, quarter-Kelly on a 100-unit bank means roughly 1.1 units per bet.
- Proportional staking: Scale up slightly (1.5–2 units) when all three confirming signals align; drop to 0.5–1 unit when only one signal is present.
Common traps:
- Low-sample markets: College basketball mid-majors or niche international soccer often have thin split data. The ticket counts are too small to be statistically meaningful.
- Mistaking ticket skew for sharp action: A 70% ticket skew with 68% of the handle is not a contrarian signal. It is a popular team with popular bettors. Handle divergence is required.
- Over-leveraging on thin markets: A single sharp bet can move a line in a low-volume market, creating false RLM. Stick to high-volume sports where splits are reliable.
- Crowded contrarian strategies: When a contrarian rule becomes widely adopted, it gets priced in. The edge shrinks. Regularly revalidate your thresholds against recent results.
Pro Tip: Measure CLV across your last 50 contrarian bets. Positive average CLV means your process is sound even if your record looks rough. Negative CLV over that sample means you are finding the wrong contrarian spots.
What tools and data sources support a contrarian workflow
No contrarian strategy works without reliable split data. Here is the tool stack that supports the full decision chain: monitor, confirm, size, and record.
- Public-sentiment and betting-splits feeds: These show live ticket % and handle % by game. They are the foundation of every contrarian signal. Without current split data, you are guessing at public positioning.
- Line-movement trackers: Tools that log opening lines, current lines, and movement history across multiple sportsbooks. Tracking line movement in real time is how you identify RLM and steam before the window closes.
- CLV calculators: Record your bet price and compare it to the closing line after the game. Over a large sample, consistent positive CLV confirms your process is finding value, not just variance.
- Book feed aggregators: Aggregate lines from multiple books to spot discrepancies. When one book moves and others lag, that gap is often where the sharpest signal lives.
- AI prediction overlays: AI-powered sports betting models add a simulation layer on top of split data, running thousands of scenarios to weight signals and estimate true probability. They are particularly useful for filtering which contrarian setups have the highest expected value. For a practical example of applied AI predictions, BetsyScore’s prediction outputs show how model-generated probabilities can complement split-based signals.
The decision chain runs in order: (1) splits feed flags a 70%+ ticket skew, (2) line-movement tracker confirms RLM, (3) AI model or manual analysis confirms the narrative, (4) CLV calculator records the bet for process tracking.
Pro Tip: Book-feed APIs update at different latencies. Some feeds lag 5–15 minutes behind real-time movement. If you are timing late-money plays, verify your data source’s update frequency before relying on it for a sharp-window bet.
How Mannysvariety applies contrarian signals with verified results
Mannysvariety operationalizes the contrarian workflow described above through sport-specific AI engines that monitor public-sentiment feeds, weight confirming signals, and run thousands of Monte Carlo simulations before generating a pick. The methodology is not a static rule set. It updates with each game, incorporating real-time line movement, handle data, and schedule factors into the model’s probability estimates.
The platform’s verified track record reflects this approach:
- 63.5% win rate across tracked picks, published with permanent archives for every graded result
- Over 1,600 successful picks recorded and publicly graded
- 443.9 net units returned, a figure that accounts for standard vig and is verifiable through the pick archive
These numbers matter because most pick services do not publish graded records. Mannysvariety’s archive allows any subscriber to audit the full history, not just the highlighted wins.
A practical use case: in an NFL week where a primetime favorite drew a very high share of public tickets but the spread dropped half a point against that action, the platform’s model flagged the RLM, confirmed a ticket/handle divergence, and generated a contrarian pick on the underdog. The bet closed at a better price than the final line, producing positive CLV regardless of the game’s outcome. That is the process working as designed.
The methodology overview and pick archive are available at Mannysvariety’s FiveThirtyEight alternatives page, which details how the models are built and how results are tracked. For the full workflow, the how it works page covers subscription tiers, trial options, and the AI signal chain from data ingestion to pick delivery.
Key Takeaways
Contrarian betting produces a consistent edge only when a 70%+ public ticket skew combines with reverse line movement, a handle divergence, and a clear reason the public has mispriced the game.
| Point | Details |
|---|---|
| 70% ticket threshold | A public skew below 70% rarely produces a reliable contrarian edge after vig. |
| Handle divergence required | Ticket % alone is insufficient; handle % must diverge to confirm sharp money is opposing the public. |
| RLM is the top confirmer | Reverse line movement combined with heavy public tickets historically produces ATS win rates in the 57–59% range. |
| CLV validates process | Tracking closing line value across 50+ bets confirms whether your contrarian picks find genuine value. |
| Mannysvariety | The platform’s AI engines monitor splits, weight RLM signals, and deliver verified picks with a 63.5% win rate and 443.9 net units tracked. |
Why most bettors misuse the contrarian approach
The phrase “fade the public” has become a social media shorthand that strips out everything that makes the strategy work. Bettors hear it, apply it to any game with a popular team, and then wonder why they are losing. The actual edge is narrow, conditional, and requires real-time data to execute correctly.
What gets overlooked most often is the handle split. Ticket percentage is visible and easy to cite. Handle percentage requires a data source and a willingness to do the extra step. That extra step is where the real signal lives. A game with 72% of tickets on the favorite but 65% of the handle on the same side is not a contrarian opportunity. It is a popular team with a lot of small bettors. The handle tells you the sharps did not disagree strongly enough to move money the other way.
The second thing bettors underestimate is the narrative requirement. Experienced practitioners recommend adding narrative diagnostics before placing a contrarian bet. Why is the public wrong on this specific game? Schedule fatigue, a misread injury report, a divisional game where the public overweights the better team’s regular-season record. Without a falsifiable reason, you are not fading the public. You are just betting the other side and calling it strategy.
The third underestimated risk is crowding. When a contrarian rule becomes widely adopted, the edge gets priced in. The market adjusts. This is why static rules decay and why process validation through CLV tracking matters more than any single threshold.
Pro Tip: When backtesting a contrarian rule, test it on out-of-sample data from a different season before trusting it. Confirmation bias in backtesting is the most common reason a rule that looks profitable in historical data fails in live betting.
Mannysvariety puts contrarian signals to work for you
Applying contrarian betting correctly requires live split data, line-movement tracking, signal weighting, and a disciplined staking plan. Most bettors have access to some of those pieces, but assembling the full workflow manually is time-consuming.

Mannysvariety delivers that workflow as a finished product. The platform’s AI engines monitor public-sentiment feeds and handle splits across MLB, NBA, NFL, NHL, and more, weight confirming signals in real time, and deliver picks with a verified 63.5% win rate and 443.9 net units returned across more than 1,600 graded results. Every pick is archived and publicly graded, so the track record is auditable, not curated. Subscription tiers include a free trial with limited features, daily and weekly passes, and full Core and Elite plans. To see how the contrarian signal chain works from data ingestion to pick delivery, visit the how it works page and start a free trial.
General information only. Confirm current regulations with your state’s gaming authority or a qualified professional before wagering.
Useful sources and further reading
The sources below back the thresholds, mechanics, and tool guidance in this article. Primary evidence sources are listed first, followed by implementation and tool resources.
- Betting Against the Public: When Contrarian Strategy Actually Works — Primary evidence source for the 70% ticket threshold, RLM win-rate data, and sport-specific contrarian mechanics across NFL and MLB.
- How to Read Betting Splits: Ticket vs. Money Percentages — Explains the ticket/handle divergence signal in detail; the foundational reference for understanding why handle outweighs ticket count.
- Contrarian Betting: When It Works and When It Fails — Practitioner analysis of why narrative diagnostics and multiple confirming signals are required; covers crowding risk and edge decay.
- Public Money and Line Movement — Explains how sportsbooks respond to public exposure and why a line that refuses to move can signal book comfort rather than contrarian opportunity.
- Fading the Public — Practical guide to identifying the best contrarian setups using the combination of extreme skew, RLM, and game narrative.
- Break-Even Percentage Calculator — Reference for the 52.4% break-even threshold at -110 odds; useful for calibrating staking plans.
- How to Analyze a Football Match: Real-Time AI Guide — Partner resource covering real-time AI-based match analysis and pregame signal construction.