

Expected Goals Betting: Turning xG Into Real Edges
Expected goals (xG) measures the probability that any given shot results in a goal, based on where it was taken from and how, and match xG is simply the sum of every shot’s probability for that team. Bettors use it to spot value in totals, both-teams-to-score (BTTS), and in-play markets when bookmaker lines lag behind what the shot data actually shows. The signal that separates useful analysis from noise is rolling xG averaged over 5 to 10 matches, plus the xG differential (xGD) between two teams over that same window.
Three things to do with this right now:
- Track a team’s rolling xG over its last 8 to 10 matches before betting any totals or BTTS market on them.
- Treat a single match’s xG as close to meaningless. One game tells you almost nothing.
- Size stakes conservatively when the edge comes from a model gap rather than confirmed news like a lineup change.
Pro Tip: A team that has scored 6 goals from 4.1 xG over its last three matches isn’t “hot.” It’s due for a correction, and the market often hasn’t priced that in yet.
Key Takeaways
Expected goals works best as a rolling, multi-match signal that flags value in totals and BTTS markets before bookmakers fully adjust their lines.
| Point | Details |
|---|---|
| Use rolling windows | Judge xG over 8 to 10 matches, never a single game, to filter out random variance. |
| Watch the xGD gap | A differential beyond +6 over a rolling window signals a meaningful, actionable edge. |
| Convert to probabilities | Run team xG through a Poisson model or shortcut to compare against bookmaker implied odds. |
| Account for blind spots | Set pieces, elite finishers, and goalkeeper form aren’t fully captured by shot-location models. |
| Cross-check before staking big | Compare two data providers, since models weigh shot inputs differently. |
| Apply it through Manny’s Variety | The platform folds xG-style signals into AI simulations behind its verified high win rate across many tracked picks. |
Table of Contents
- What Is Expected Goals in Football Betting?
- Why Expected Goals Matters for Smarter Wagers
- How to Bet on Expected Goals: A Practical Playbook
- Turning xG Into Match Probabilities
- Where to Find Reliable xG Data
- How Manny’s Variety Applies xG Signals
- Combining Expected Goals With Other Match Stats
- Real-World Examples of xG Shaping Betting Outcomes
- Limitations of xG Models and How to Adjust
- Frequently Asked Questions
- Sources
What Is Expected Goals in Football Betting?
Expected goals assigns every shot a probability between 0 and 1 based on how likely a shot from that exact position, angle, and situation is to end up in the net. A penalty carries roughly 0.76 xG. A close-range tap-in from a rebound might sit around 0.35. A speculative strike from 30 yards out could be worth 0.02. Add up every shot’s value for a team across 90 minutes and you get that match’s team xG.
Modern models, the kind used by data providers like Opta, FBref, and Understat, and pioneered commercially by firms like StatsBomb, weigh several inputs when calculating a shot’s value:
- Distance from goal and the angle of the shot
- Body part used (a header carries far lower value than a clean strike with the strong foot)
- Assist type, since a cutback or through ball produces higher-quality chances than a long ball
- Defensive pressure at the moment of the shot
- Whether the shot came from a set piece, which providers typically flag separately
You’ll also run into a few common variants. Non-penalty xG (npxG) strips out penalty kicks so a lucky spot-kick doesn’t inflate a team’s underlying attacking numbers. xA (expected assists) measures the quality of chances a player creates rather than takes. xG per shot tells you how a team generates its chances, since a side averaging 0.15 xG per shot is manufacturing far better looks than one grinding out 0.08 per shot from volume alone.
Here’s the practical distinction that trips up new bettors: a team can post an identical match xG total of 1.8 by taking three great chances or fifteen mediocre ones. Those are very different teams to bet on going forward, and the shot-by-shot breakdown tells you which one you’re looking at.
Why Expected Goals Matters for Smarter Wagers
Goals are rare and heavily influenced by randomness. A deflection, a goalkeeper error, or a woodwork bounce can decide a match without reflecting which team actually created better chances. xG strips out that noise by measuring chance quality instead of finishing luck, which is exactly why it correlates so strongly with underlying team performance over a longer stretch.
The data backs this up convincingly. A deep analysis of StatsBomb’s open data across five competitions found an overall correlation of roughly 0.89 between team xG and actual goals scored, climbing to about 0.91 in the Premier League specifically. That same analysis flagged a real home-field pattern: home teams have historically tended to perform better than their xG suggests at home, while away teams tend to perform somewhat worse, a gap worth factoring into any home/away xG comparison you run.
Expected goals works best as a compass over a season, not a stopwatch for one match. BBC Sport’s analysis found xG picked the correct match outcome in as few as 3 of 10 matches in some sample weeks, and as many as 7 or 8 in others, with seasonal accuracy settling around the mid-to-high 50% range.
That single stat is the whole argument for why single-match xG readings mislead more than they inform. A team can be genuinely unlucky for six straight weeks and still be the better side. Regression to the mean is the mechanism: teams that persistently outscore their xG tend to cool off, and teams stuck underperforming tend to catch up, which is precisely where mispriced totals and BTTS lines show up. But the model has real blind spots. It typically undervalues elite finishers who convert difficult chances at an above-average rate, it can misjudge set-piece-heavy teams whose set-play routines aren’t fully captured, and it says nothing about a goalkeeper running hot or cold.
How to Bet on Expected Goals: A Practical Playbook
Rolling xG averages are the backbone of any xG betting strategy. Calculate a team’s average xG for and against over their last 8 to 10 matches rather than looking at any single game. That window is wide enough to smooth out randomness but recent enough to reflect the current squad, tactics, and form. Anything shorter than 5 matches is close to noise; anything you stretch past 10 starts dragging in stale form from a different manager or transfer window.
Here’s how to turn that rolling data into actual betting decisions:
- Pull the rolling xG for both teams. Compare attacking xG for and defensive xG against over the last 8 to 10 matches for each side.
- Calculate the xG differential (xGD). Subtract xG against from xG for. According to practical thresholds from ScanGoal’s analysis, a differential between -2 and +2 over a rolling window is generally noise. A gap of +3 to +5 suggests mild overperformance worth monitoring. Anything beyond +6 is a meaningful signal.
- Check whether the market has priced in that gap. If a team’s rolling xG suggests 2.4 goals per match, but the Over 2.5 line still reflects last month’s lower-scoring form, that’s your value.
- Cross-reference BTTS and Asian handicap lines against combined xG. A match where both teams post rolling xG above 1.3 is a stronger BTTS candidate than raw scoring history alone would suggest.
- Watch in-play markets for lag. Live odds often react to the scoreline before they react to shot quality. A team dominating xG at 0.0 to 0.0 is frequently a better next-goal or live-totals bet than the current price implies.
A few context adjustments matter more than the raw numbers. Set-piece-heavy teams can outperform their open-play xG consistently, so check whether a team’s model has a distinct flag for corners and free kicks. A hot or cold goalkeeper skews actual goals against without moving the underlying xG at all, and a red card or confirmed injury to a key striker invalidates a rolling average instantly, since the model was built on a different roster.
Stake sizing should scale with your confidence in the gap, not with how good the bet feels. A model-driven edge from a 10-match rolling xGD deserves a smaller stake than a bet confirmed by breaking lineup news, because model signals carry more inherent uncertainty. Bankroll management fundamentals apply directly here: never let a strong xG signal talk you into staking beyond your normal unit size. If betting starts to feel compulsive rather than analytical, resources like GambleAware and Gambling Therapy offer support and practical safeguards.
Turning xG Into Match Probabilities
Raw xG numbers become useful for betting once you convert them into win, draw, and loss probabilities you can compare against bookmaker odds. The standard method, as Agentbets lays out, uses a Poisson distribution: you take each team’s expected goal rate and calculate the probability of every plausible scoreline, then sum those into win/draw/loss and over/under probabilities.
You don’t need to build a Poisson model from scratch to use this. Here’s the practical path:
- Pull each team’s recent non-penalty xG (npxG), ideally averaged over 5 to 10 matches, split into attacking output and defensive input.
- Average the attacker’s xG for against the opponent’s xG against to get a rough estimate of expected goals in that specific matchup.
- Run that number through a Poisson calculator to generate scoreline and totals probabilities, or use a simple averaging shortcut for a quick gut check before committing.
- Compare your probability to the bookmaker’s implied probability from the odds. A gap of several percentage points is your signal to look closer.
| Team match xG estimate | Approx. Poisson probability of Over 2.5 goals |
|---|---|
| 1.2 combined | Low |
| 2.5 combined | Moderate, roughly 50% |
| — | High |
A step-by-step workflow from Soccer Expert Advisor recommends exactly this approach: gather recent npxG, average attacker against defense, and convert with either a full Poisson model or a lightweight shortcut. The math assumes goal events are independent, which mostly holds in domestic league play but breaks down faster in international fixtures with tiny sample sizes and unfamiliar lineups. For anyone building repeatable models around tournament play, the World Cup prediction model guide covers those small-sample adjustments in more depth. A quick averaging shortcut is fine for a sanity check before kickoff; a full Poisson calculator earns its place when real money and a genuine edge are on the line.
Where to Find Reliable xG Data
xG data comes from a handful of source types, and each one fits a different workflow. Open datasets from providers like StatsBomb give you shot-level detail for historical analysis. League trackers such as FBref and Understat offer free, browsable team and player xG for major competitions. Live xG widgets update in real time during a match, which matters for in-play bettors watching shot quality accumulate. Prediction sites bundle xG into pre-built probabilities, and APIs or data exports suit anyone building a personal model or spreadsheet.
Before trusting any source with real stakes, run it through a short checklist:
- Coverage: Does it track the leagues and competitions you actually bet on?
- Transparency: Does the provider explain what inputs feed the model, or is it a black box?
- Update cadence: Is data refreshed within minutes of the final whistle, or does it lag by a day?
- Exportability: Can you pull the numbers into a spreadsheet, or are you stuck screenshotting?
- Historical depth: Does it go back far enough to build a meaningful rolling average?
Different providers build different models, so the same match can show a 1.4 xG reading on one site and 1.7 on another. Neither is wrong. They’re weighing shot inputs differently. Spot-check a handful of recent matches against your own eye test, look at how each source flags penalties and set pieces specifically, and cross-check two sources before committing a larger stake on any single number. The best betting analysis sites guide and the analytics tools roundup both cover this evaluation process in more detail, and if you want a plain mathematical primer on the conversion step itself, this Poisson goal model explainer walks through the logic clearly.
How Manny’s Variety Applies xG Signals
Manny’s Variety runs sport-specific AI engines that process thousands of simulations per matchup, folding shot-quality data like xG into a broader signal set, alongside form, injuries, and market movement.
At a high level, xG feeds an AI predictive engine the same way it feeds a human analyst: as one input among several that gets weighed, tested against recent form, and adjusted for context the raw number can’t see, like a returning striker or a suspended defender.
A model that ignores shot quality reacts only to final scores. One that incorporates xG reacts to underlying performance, which tends to catch mispriced totals and BTTS lines before the broader market corrects.
If you want to see this in action rather than take it on faith, the game analysis and matchup breakdowns page archives the reasoning behind past picks so you can compare the signal against the outcome yourself.
Combining Expected Goals With Other Match Stats
xG alone rarely tells the whole story. Shots on target, possession share, and passes into the final third all add context that sharpens or challenges what the xG number suggests.
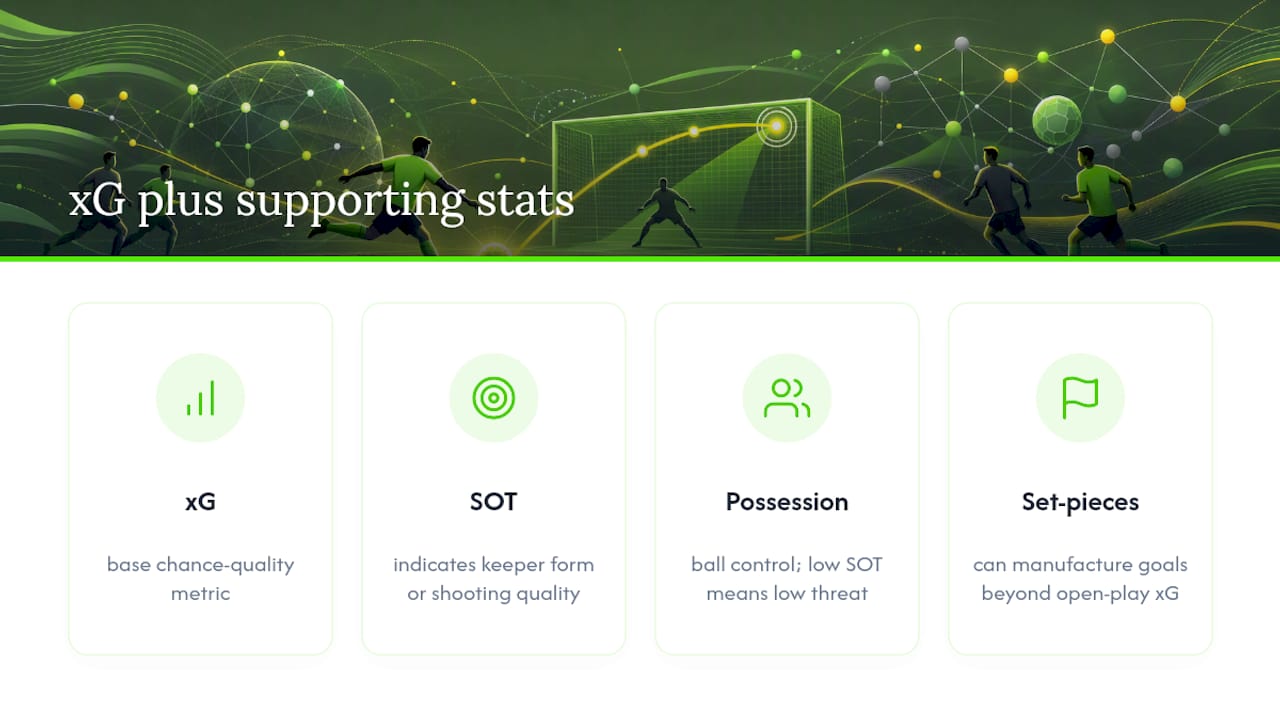
A team generating strong xG but landing few shots on target might be facing a hot goalkeeper or simply shooting poorly on the night, both of which are more likely to correct than a genuine quality-of-chances problem. Conversely, a team converting a high share of low-value shots into shots on target may have a finishing edge the base xG model undervalues, particularly with a striker known for beating his expected conversion rate.
Possession tells you something different: control of the ball. Pair that with a low shots-on-target count and you’re looking at a team that looks good on the scoreboard of stats but isn’t actually threatening. That combination often shows up in Under totals value, since neither the eye test nor a possession-only read would flag it.
Set-piece frequency is another layer worth cross-referencing. A team taking an unusually high number of corners and free kicks relative to its open-play xG may be manufacturing goals from routines the base shot model captures imperfectly. Checking shots on target, possession, and set-piece share alongside the headline xG number turns a single data point into a fuller read of how a team is actually generating and converting chances.
Real-World Examples of xG Shaping Betting Outcomes
The clearest examples of xG creating betting value come from teams stuck in a visible over or underperformance streak relative to their shot quality. A side that has scored 8 goals from 5.2 xG across a five-match stretch is finishing well above what the shot data supports, and betting markets often keep pricing that team’s next Over line as if the hot streak will continue. It usually doesn’t, at least not at that pace, and bettors tracking the rolling xGD have a real edge fading that continuation.

The reverse pattern shows up just as often. A team generating 2.0-plus xG per match but scoring closer to 1.2 goals per game is a textbook case for value on their next Over 2.5 or BTTS line, since bookmakers pricing off recent scorelines rather than shot quality tend to lag behind the correction. Once that team’s finishing regresses toward its underlying xG, which the correlation data suggests happens with real reliability over a full season, the goals tend to arrive in a cluster.
Home and away splits provide another concrete pattern bettors can act on. Because home teams have historically overperformed their xG by a wider margin than away teams underperform theirs, a strong home xG reading deserves slightly more trust than an identical away xG figure. That doesn’t mean betting blindly on home favorites. It means weighting the differential a notch differently depending on venue, a small adjustment that compounds meaningfully across a season of bets.
Limitations of xG Models and How to Adjust
Expected goals models carry real blind spots that bettors need to price into their confidence level, not just their prediction. Different providers build different models with different weightings, so the same match can generate different xG readings depending on the source, which is exactly why cross-checking two providers before a larger stake matters.
Set pieces remain a persistent weak spot. Corner routines and free-kick deliveries vary enormously in execution quality, and most models struggle to fully capture that nuance, which means set-piece-heavy teams can systematically outperform their raw xG without it signaling regression. Elite finishers present a similar problem: a player who consistently beats his expected conversion rate isn’t necessarily due for a correction. He might just be better than the average shooter the model was trained on. Weather, referee tendencies, and a goalkeeper running unusually hot are all factors the shot-location math simply doesn’t see.
The practical adjustment is straightforward: treat xG as one strong input rather than a complete answer. Widen your rolling window when a team has a new manager, key transfer, or long injury absence, since older data no longer reflects the current setup. Lower your stake size when the only edge you’re relying on is a model gap unconfirmed by lineup news or tactical shift. And when a match involves extreme weather, a last-minute injury to a key player, or a sample size too small to trust, the better play is often no play at all.
A Personal Note on Using xG Responsibly
My own routine before betting any total or BTTS market starts with checking rolling xG across 5 to 10 matches and cross-checking it against a second provider, since single-source numbers can mislead. In-play, I size stakes smaller than pre-match bets, because live shot data updates fast and overreacting to a hot 20 minutes is a common mistake.
I pass entirely when the sample is tiny, the weather is extreme, or a key injury broke right before kickoff. No model, xG included, adjusts for that fast enough to trust blindly.
How Manny’s Variety Puts xG Signals to Work For You
Reading rolling xG charts and running your own Poisson conversions takes time most bettors don’t have during a full slate of weekend fixtures. Manny’s Variety exists for exactly that gap: its sport-specific AI engines run thousands of simulations per matchup, weighing shot-quality signals like xG alongside form, injury news, and market movement, so you get a finished pick instead of a spreadsheet to build yourself.

The daily picks pull from the same kind of match-level analysis this article walks through manually, covering totals, BTTS, and player props across soccer and other major sports. Live in-game picks apply that same shot-quality read as matches unfold, catching the market lag this article flagged as one of the clearest in-play opportunities. Every pick sits inside a permanent, publicly graded archive rather than disappearing after the fact, which is a level of transparency few competitors in this space offer.
If you want to see how the model reasoning plays out on real matches before committing, start with how the platform works, then check the live in-game picks for soccer’s current slate. A free trial is available for readers who want to test the approach before subscribing, and as with any betting strategy, wager only what you can afford to lose.
Frequently Asked Questions
What’s the difference between xG and actual goals in betting? xG measures chance quality regardless of outcome, while actual goals reflect finishing and luck on the day. A team can win 3 to 0 with 0.8 xG or lose 0 to 1 with 2.5 xG, and the gap between the two numbers over several matches is often more predictive than either figure alone.
How many matches should I look at before trusting an xG signal? Most practical guidance points to 8 to 10 matches as the sweet spot, wide enough to smooth out randomness but recent enough to reflect current form, per ScanGoal’s rolling-window recommendation.
Can I use xG for in-play betting? Yes, and it’s one of the more effective uses. Live xG accumulation often reveals dominant performances before the scoreline catches up, creating value on next-goal and live totals markets while the price still reflects the 0 to 0 state.
Do all xG providers use the same model? No. Providers like StatsBomb, Opta, and Understat weigh shot location, pressure, and assist type differently, so the same match can show slightly different xG totals depending on the source. Cross-checking two providers before a larger stake is good practice.
Is xG useful for player props? Indirectly. A striker’s underlying npxG and shot volume tell you more about his goal-scoring odds than recent finishing streaks, which makes it a useful cross-check for player prop markets built around anytime scorer or shots-on-target lines.
Sources
- Why xG can’t always tell us how good a team really is - BBC Sport
- xG vs Actual Goals: A Deep Dive Into StatsBomb Open Data Across 5 Competitions - DEV Community
- xG vs Actual Goals: How to Read the Gap · ScanGoal
- Agentbets