

Project Game Pace in 15 Minutes, NBA Pace Betting Workflow
Yes, pace matters, and it’s measurable enough to bet on. Project each team’s possessions, convert them to points using points-per-possession, then bet totals or spreads only when your number diverges meaningfully from the market. The core workflow: pull season and last-10 pace for both teams, adjust for rest and rotation changes, multiply the result by expected scoring efficiency, and compare that total to the sportsbook line before you touch your bankroll.
TL;DR:
- Fast-paced teams often generate five to eight more possessions per game than the league average, which significantly impacts total scoring estimates.
- Using last-10 game pace data provides a more accurate reflection of current team tempo compared to season averages, especially late in the season.
- Adjusting pace projections for home/away splits, injuries, and rest situations is crucial to refine accuracy, as these factors can alter a team’s tempo by several percentage points.
- Converting projected possessions into totals requires estimating teams’ points per possession, which varies with matchup-specific factors like defense and shooting efficiency.
- Comparing your projection against the sportsbook line, with a four-point or greater gap, offers the best potential for value, while smaller differences are often noise.
Table of Contents
- What NBA Pace Betting Actually Means
- Where to Find Reliable Pace Data (and What to Actually Pull)
- How to Project Game Pace: A Step-by-Step Method
- Turning Possessions Into a Bettable Total (and Spread)
- The Situational Factors That Move Your Pace Numbers
- A Pre-Game and Live Betting Checklist You Can Actually Use
- How an AI-Driven Model Applies Pace to Real Picks
- Why Pace Alone Will Never Be Enough
- Test Your Pace Math Against a Verified Model
- Sources
- FAQ
What NBA Pace Betting Actually Means
Pace, in NBA terms, is the number of possessions a team uses per 48 minutes. It’s not the same as “fast breaks” or highlight-reel speed. A team can push tempo with quick, low-value shots or grind out extra possessions through offensive rebounding and forced turnovers, and both count toward the same pace number.
The standard formula, borrowed from basketball analytics and used by most public data providers, estimates possessions as:
Possessions ≈ FGA + 0.44 × FTA − Offensive Rebounds + Turnovers
Apply that to both teams in a matchup, average the two figures, and you get an estimated game pace. That number becomes the foundation for every totals projection you’ll build, because the math behind NBA total points betting reduces to one equation: possessions × points per possession = expected points. Get the possession count wrong, and everything downstream, your total, your spread lean, your prop numbers, drifts off with it.
League-average pace hovers in a fairly tight band year to year, but individual teams can stretch well past it in either direction:
- Fast-paced teams typically run 5 to 8 more possessions per game than the league average, often through aggressive transition offense or high-turnover defense.
- Slow-paced teams deliberately shorten the shot clock usage, walking the ball up and hunting isolation looks that eat clock.
- Matchup pace (the average of both teams’ individual pace marks) predicts game tempo far better than looking at either team in isolation.
This is the entry point for any serious basketball pace analysis. Skip it, and you’re betting totals on gut feel dressed up as a hunch.
Where to Find Reliable Pace Data (and What to Actually Pull)
You don’t need a subscription to a data terminal to do this right. A handful of public sources cover almost everything a bettor needs, provided you know which fields to check.
- Team-level pace pages on major stats sites give season averages, but the number that matters more on game day is the last-10-game pace, since rotations, injuries, and coaching adjustments shift tempo mid-season faster than a full-season average reflects.
- Play-by-play pace trackers break tempo down by quarter, which matters because pace isn’t constant across 48 minutes. Research on intra-game pace segmentation found that high-frequency possession segments increase toward the ends of quarters and especially in the fourth, while low-frequency stretches dominate the middle of games.
- Home/away pace splits matter more than most bettors assume. Some teams push tempo harder at home in front of their crowd and slow things down on the road.
- Lineup on/off splits show how pace changes when a specific ball handler or rim runner sits. This becomes critical once you start adjusting for injuries.
On game day, the fastest workflow is a three-tap routine: pull each team’s last-10 pace, check the injury report for anyone who materially changes tempo, then note the home/away split for whichever team is on the road. That takes under five minutes and gives you a real number to work from instead of a guess.
How to Project Game Pace: A Step-by-Step Method
Building a possession projection isn’t complicated, but skipping steps is where most bettors lose their edge. Here’s the reproducible method.
- Pull season pace and last-10 pace for both teams from a public stats source.
- Weight the last-10 figure more heavily than the season average, especially after the All-Star break when rotations and roles are more settled. A 60/40 weighting toward last-10 numbers is a reasonable starting point.
- Average the two teams’ weighted pace figures to get a raw projected game pace.
- Adjust for home court. Home teams often play slightly faster; road teams facing a tough environment sometimes slow the game to control possessions.
- Adjust for rest and lineup changes. A back-to-back game or a missing starter shifts tempo in a predictable direction (more on that below).
- Finalize your projected possession count for the game.
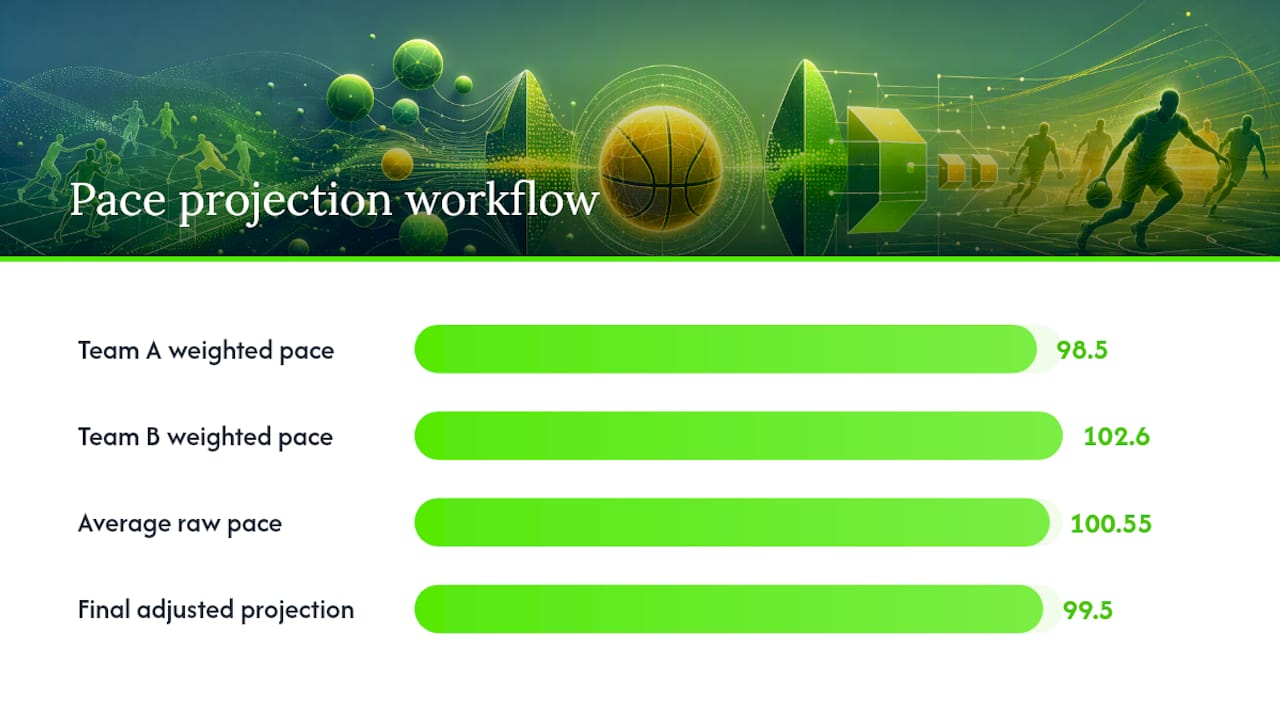
Here’s a worked example using two hypothetical teams:
Average the weighted figures: (98.5 + 102.6) / 2 = 100.55 possessions. Team B is on the road on the second night of a back-to-back, a spot that historically shaves off a possession or two, so you adjust down to roughly 99.5 projected possessions for the game. That number, not the posted total, is your anchor point going forward.
Turning Possessions Into a Bettable Total (and Spread)
Possessions alone don’t win bets. You need points per possession (PPP), the average points a team scores each time it has the ball, to convert your pace projection into a number you can compare against the market. League PPP typically sits in a narrow range, but individual teams vary based on shooting efficiency, three-point volume, and free-throw rate.
- Estimate each team’s PPP, using season average as a baseline and adjusting for the specific matchup (a slow, physical defense knocks PPP down; a leaky perimeter defense bumps it up).
- Multiply projected possessions by each team’s PPP to get individual scoring projections.
- Add both team projections together to get your game total.
- Compare that number to the posted total. A gap of two points or fewer is usually noise. A gap of four or more points, especially in a matchup between two high-pace teams, is where the value lives.
Worked example, continuing from the possession projection above: at 99.5 total possessions split roughly evenly, each team gets close to 49.75 offensive possessions. If Team A projects at 1.15 PPP and Team B at 1.10 PPP, that’s 57.2 points for Team A and 54.7 for Team B, a projected total near 112 points. If the sportsbook posted 116.5, you’d lean under. If it posted 108, you’d lean over. Either way, you’re betting your number against the market’s, not a feeling.
This same logic extends past totals. Season-level data shows that games between two top-10 pace teams hit the over at materially higher rates than neutral matchups, which is exactly what your possession math would predict, more possessions generally means more scoring opportunities for both sides.
Pace also reshapes spreads and player props, even though the mechanism is less direct:
- A team that projects to play significantly faster than its opponent’s preferred tempo often gains a slight schedule-independent edge, since it dictates the game’s rhythm.
- Player props tied to pace (points, assists, rebounds) move with possession counts. A guard who plays 34 minutes in a 102-possession game touches the ball more times than in a 92-possession slog, even at identical usage rate.
- When rotations shift, converting team possession changes into per-player opportunity projections requires estimating both the new minutes distribution and any change in usage share, not just the raw possession count.
The Situational Factors That Move Your Pace Numbers
Season averages give you a baseline. These modifiers are what separate a sharp projection from a lazy one.
- Rest and back-to-backs. Teams playing the second game of a back-to-back, or a fourth game in five nights, consistently show lower pace and worse shooting efficiency. Schedule spots remain one of the more exploitable edges in NBA betting, and the lean is almost always toward the under when both fatigue and pace point the same direction. Manny’s Variety’s breakdown of NBA back-to-backs digs deeper into the specific schedule spots that matter most.
- Injuries and rotation changes. Losing a primary ball handler doesn’t just remove points, it removes possessions, since that player was likely initiating offense and pushing tempo. Estimate the possession and PPP delta before trusting a season-average pace number. A structured injury report workflow helps translate news into usable numbers instead of vague hunches.
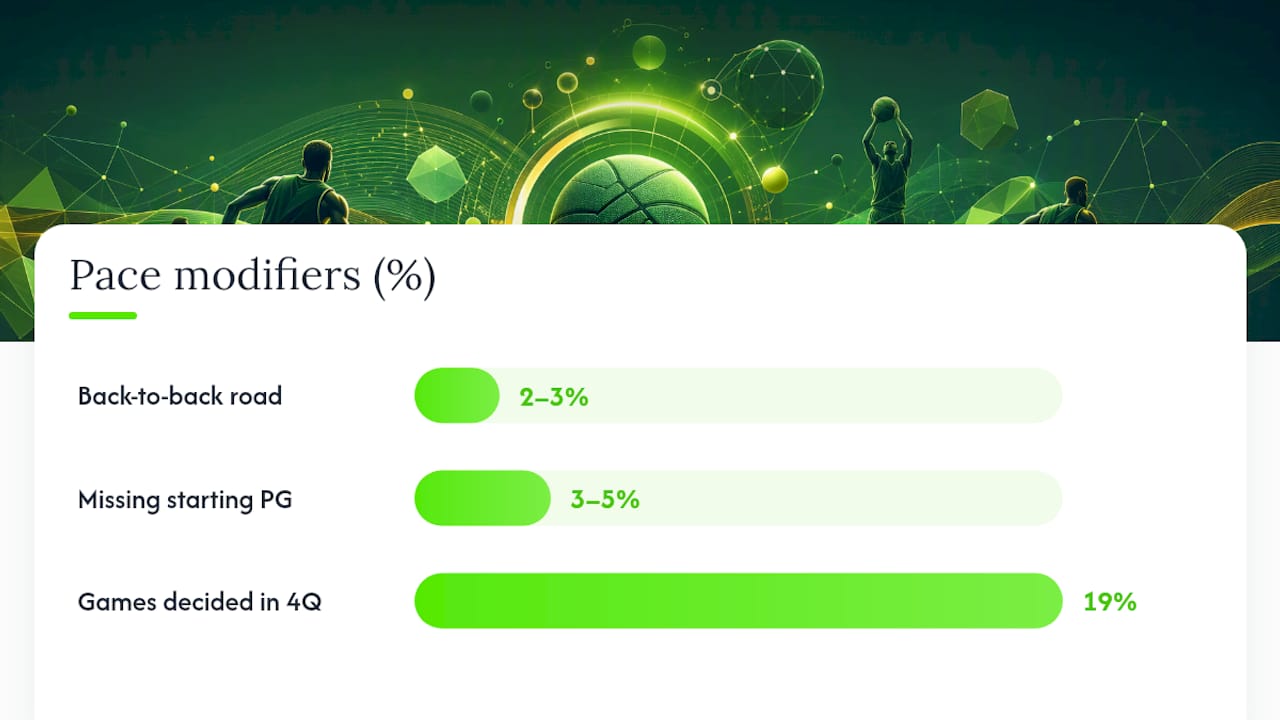
- Game script. A team protecting a double-digit lead slows the game deliberately, running clock and avoiding turnovers. A team trailing by 15 in the fourth speeds up out of necessity. Research on 2,295 NBA games found that 19% are decided in the fourth quarter, with close games often slowing to roughly 90 to 100 possessions for the full contest, a meaningful drop from a fast-paced first three quarters.
- Fourth-quarter tempo dynamics. These aren’t just theoretical. The same PLOS study on intra-game segmentation found that high-frequency possession stretches actually increase near the ends of quarters, even as overall late-game pace slows in tight contests. That’s the tension bettors need to track live: garbage-time possessions accelerate, clock-killing possessions in close games decelerate, and the two can offset in ways a simple average misses.
Pro Tip: When a projected close game hits the fourth quarter, don’t assume overall pace collapses evenly. Watch the score margin first. A one-possession game in the final five minutes often plays slower than a 12-point game with garbage time approaching.
Fold these modifiers in as percentage adjustments rather than rebuilding your whole projection. A back-to-back road game might justify a 2 to 3 percent pace reduction; a missing starting point guard might justify 3 to 5 percent, depending on usage.
A Pre-Game and Live Betting Checklist You Can Actually Use
Here’s the workflow, start to finish, condensed into steps you can run in under fifteen minutes before tip-off.
- Pull season and last-10 pace for both teams.
- Check the injury report and note any rotation change that affects a primary ball handler or high-usage scorer.
- Compute your own projected total using the possession and PPP method above.
- Compare your number to the posted market total and spread.
- Only place a bet when the gap between your projection and the market number is wide enough to survive normal variance, a two-point gap is usually noise; four points or more on a total is where most sharp bettors start paying attention.
Staking discipline matters just as much as the projection itself:
- Size your bet to your confidence level, not your excitement about the matchup. A tempo mismatch you’re highly confident in still deserves a standard unit, not a career bet.
- Keep a strict cap on how much of your bankroll rides on any single tempo-driven play, since pace projections carry real variance even when your math is sound. Manny’s Variety’s bankroll management guide lays out specific staking rules worth following.
- For live betting, watch actual possession counts through the first quarter against your pre-game projection. If the game is running noticeably faster or slower than expected by the second quarter, that’s real information, not noise, and it’s a legitimate signal to bet the live total in the direction the pace is trending.
- Substitution patterns matter live too. A team pulling its starters early with a big lead is telling you pace is about to drop, regardless of what the season average says.
How an AI-Driven Model Applies Pace to Real Picks
Manny’s Variety builds its NBA predictive engine around the same possession-based logic covered in this article, but automates the parts that take a human bettor the longest: pulling pace splits, tracking rotation news, and running the calculations across every game on the slate.
- The model ingests team and matchup pace, offensive and defensive efficiency, rest situations, and rotation changes as core inputs, then runs thousands of simulations per game to generate a projected total and spread.
- Manny’s Variety has tracked over 1,600 graded picks with a 63.5% win rate and a net return of 443.9 units, a public record bettors can check against the platform’s own tracker rather than take on faith.
- The platform’s methodology is laid out on its how it works page, which explains the simulation approach behind each pick.
Treat any AI-generated pick, Manny’s Variety included, as a cross-check against your own possession math, not a replacement for it. If your manual projection and the model’s number land in the same place, that agreement is a stronger signal than either number alone. If they diverge sharply, that’s worth investigating before you bet either side.
Why Pace Alone Will Never Be Enough
Pace tells you how many chances a team gets. It doesn’t tell you what they do with those chances, and that gap is where a lot of bettors get burned. A team can run a fast, ugly offense and still lose the efficiency battle badly. Recent league data actually showed a negative correlation in one season between team pace and offensive rating, meaning some of the fastest teams in the league were also among the least efficient.
That’s a real trap for bettors who see “high pace matchup” and jump straight to the over without checking whether either team can actually score efficiently. Selection bias creeps in here too: teams that play fast sometimes do so because they’re bad defensively and giving up easy transition buckets, not because they’re a well-oiled offensive machine. Pace and quality are correlated, but not interchangeable.
Small samples make this worse. Playoff pace typically runs a few possessions slower than regular-season pace as rotations tighten and physicality increases, and short-term streaks can look like a pace shift when they’re really just three unusual games in a row. Weight your bet sizing down when you’re working from a thin sample, no matter how clean the tempo story looks on paper.
— Manuel
Test Your Pace Math Against a Verified Model
Building possession projections by hand is the right foundation, but checking your work against a system that runs thousands of simulations per game closes the gap between a good guess and a sharp number. Manny’s Variety’s NBA engine factors pace, rest, and rotation changes into every pick it publishes, and the full history is graded in public, not cherry-picked after the fact.

The platform offers a free tier to compare the model’s picks to your own projections, while paid tiers unlock daily picks, player props, and live in-game signals across the full slate. If you’re building tempo-based totals plays tonight, check the live picks page before tip-off and compare it against your own possession math. Full pricing details are on the pricing page.
Sources
The possession segmentation research behind Q4 tempo shifts comes from a peer-reviewed study on intra-game basketball pace dynamics, useful for anyone building live-betting rules. For efficiency context, the ESPN piece on pace versus offensive rating is worth a full read before you bet any high-pace matchup blind. If tempo betting starts affecting your budgeting or self-control, resources like BeGambleAware and staking guides such as DropSkin’s wagering-mistakes breakdown are worth keeping on hand.
- Inner pace: a dynamic exploration and analysis of basketball game pace
- NBA teams all want to play faster – is it making them worse?
- NBA Betting Strategy: Points, Props, and Profitable Angles (2026)
FAQ
What does NBA pace mean?
NBA pace is the estimated number of possessions a team uses per 48 minutes, calculated roughly as field goal attempts plus 0.44 times free throw attempts, minus offensive rebounds, plus turnovers. It measures how many scoring chances a team generates or allows, not how fast they physically run the floor.
What is the best NBA betting strategy?
There’s no single best approach, but a possession-based method, projecting pace, converting it to points with PPP, and comparing that number to the market total, gives bettors a reproducible edge rather than a hunch. Combining that with situational checks for rest, injuries, and game script, the same inputs Manny’s Variety’s model uses, sharpens the projection further.
Is it possible to earn $100 a day with sports betting?
Consistent daily profit isn’t guaranteed for anyone, since NBA outcomes carry real variance even with sound projections. A disciplined approach, sizing bets to confidence and tracking results over a large sample, matters far more than chasing a fixed daily number.
How do you calculate pace in the NBA?
The standard formula estimates possessions as field goal attempts plus 0.44 times free throw attempts, minus offensive rebounds, plus turnovers, applied to both teams and averaged for a game-level pace figure. Public stats sites publish this number directly, so most bettors pull it rather than calculating it from box scores by hand.